Immigrants from Bahamas vs Hispanic or Latino Median Household Income
COMPARE
Immigrants from Bahamas
Hispanic or Latino
Median Household Income
Median Household Income Comparison
Immigrants from Bahamas
Hispanics or Latinos
$71,349
MEDIAN HOUSEHOLD INCOME
0.0/ 100
METRIC RATING
313th/ 347
METRIC RANK
$73,823
MEDIAN HOUSEHOLD INCOME
0.1/ 100
METRIC RATING
291st/ 347
METRIC RANK
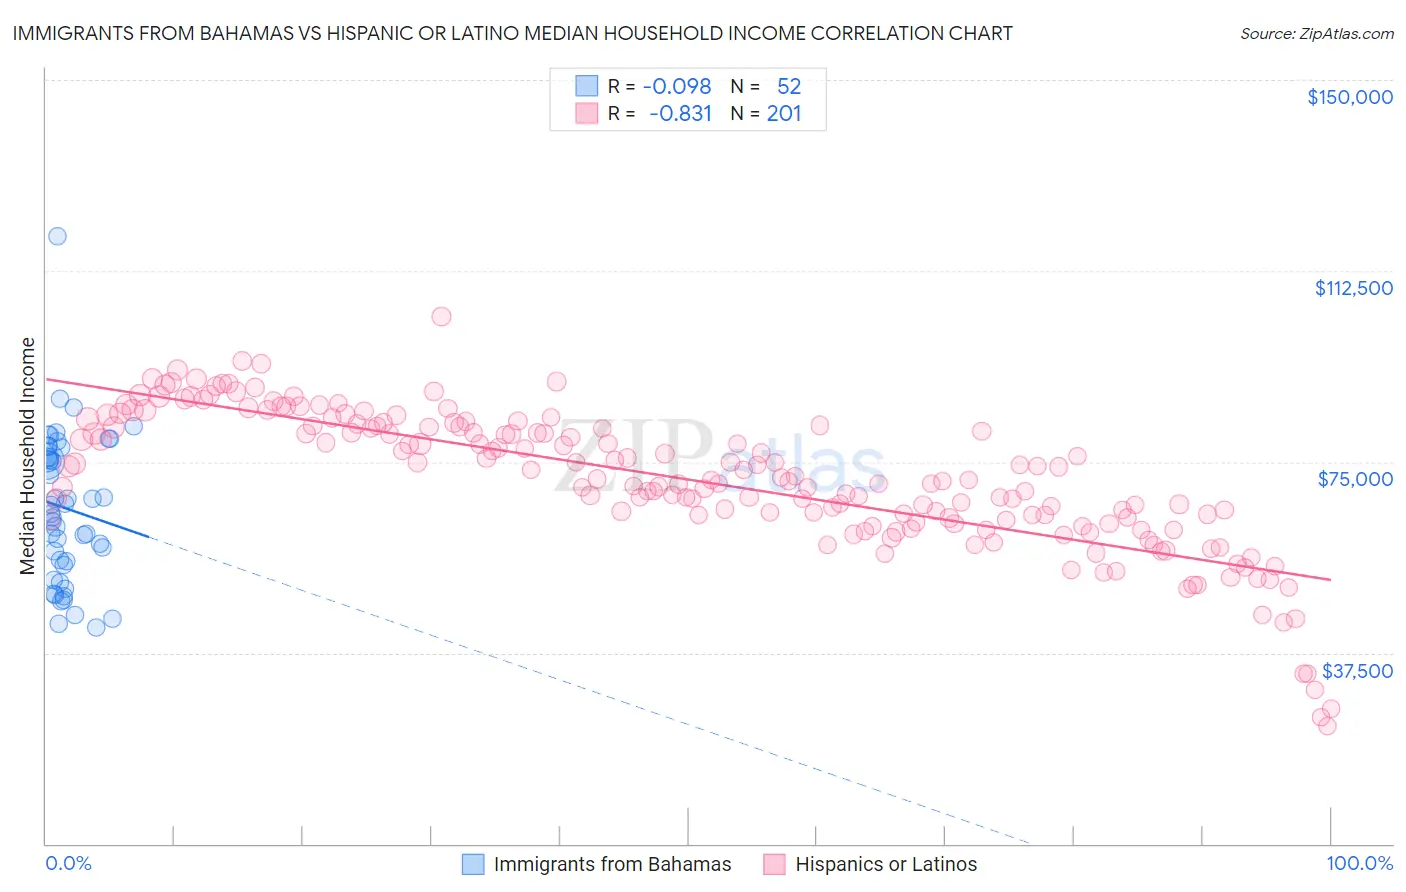
Immigrants from Bahamas vs Hispanic or Latino Median Household Income Correlation Chart
The statistical analysis conducted on geographies consisting of 104,583,931 people shows a slight negative correlation between the proportion of Immigrants from Bahamas and median household income in the United States with a correlation coefficient (R) of -0.098 and weighted average of $71,349. Similarly, the statistical analysis conducted on geographies consisting of 577,204,907 people shows a very strong negative correlation between the proportion of Hispanics or Latinos and median household income in the United States with a correlation coefficient (R) of -0.831 and weighted average of $73,823, a difference of 3.5%.
Median Household Income Correlation Summary
| Measurement | Immigrants from Bahamas | Hispanic or Latino |
| Minimum | $42,496 | $23,087 |
| Maximum | $119,201 | $103,536 |
| Range | $76,705 | $80,449 |
| Mean | $65,863 | $71,424 |
| Median | $65,628 | $71,562 |
| Interquartile 25% (IQ1) | $55,065 | $63,567 |
| Interquartile 75% (IQ3) | $76,891 | $81,961 |
| Interquartile Range (IQR) | $21,825 | $18,394 |
| Standard Deviation (Sample) | $14,679 | $13,788 |
| Standard Deviation (Population) | $14,537 | $13,754 |
Similar Demographics by Median Household Income
Demographics Similar to Immigrants from Bahamas by Median Household Income
In terms of median household income, the demographic groups most similar to Immigrants from Bahamas are Dominican ($71,302, a difference of 0.060%), Immigrants from Honduras ($71,452, a difference of 0.15%), Ottawa ($70,984, a difference of 0.51%), Apache ($70,927, a difference of 0.59%), and Immigrants from Zaire ($71,801, a difference of 0.63%).
| Demographics | Rating | Rank | Median Household Income |
| Potawatomi | 0.0 /100 | #306 | Tragic $72,576 |
| Ute | 0.0 /100 | #307 | Tragic $72,402 |
| Yakama | 0.0 /100 | #308 | Tragic $72,225 |
| Immigrants | Caribbean | 0.0 /100 | #309 | Tragic $71,860 |
| U.S. Virgin Islanders | 0.0 /100 | #310 | Tragic $71,853 |
| Immigrants | Zaire | 0.0 /100 | #311 | Tragic $71,801 |
| Immigrants | Honduras | 0.0 /100 | #312 | Tragic $71,452 |
| Immigrants | Bahamas | 0.0 /100 | #313 | Tragic $71,349 |
| Dominicans | 0.0 /100 | #314 | Tragic $71,302 |
| Ottawa | 0.0 /100 | #315 | Tragic $70,984 |
| Apache | 0.0 /100 | #316 | Tragic $70,927 |
| Cajuns | 0.0 /100 | #317 | Tragic $70,605 |
| Chippewa | 0.0 /100 | #318 | Tragic $70,539 |
| Immigrants | Dominican Republic | 0.0 /100 | #319 | Tragic $70,208 |
| Colville | 0.0 /100 | #320 | Tragic $70,094 |
Demographics Similar to Hispanics or Latinos by Median Household Income
In terms of median household income, the demographic groups most similar to Hispanics or Latinos are Comanche ($73,747, a difference of 0.10%), Bangladeshi ($74,112, a difference of 0.39%), Immigrants from Cabo Verde ($73,515, a difference of 0.42%), Blackfeet ($73,509, a difference of 0.43%), and Fijian ($74,205, a difference of 0.52%).
| Demographics | Rating | Rank | Median Household Income |
| Yaqui | 0.1 /100 | #284 | Tragic $74,596 |
| Mexicans | 0.1 /100 | #285 | Tragic $74,399 |
| Immigrants | Somalia | 0.1 /100 | #286 | Tragic $74,300 |
| Iroquois | 0.1 /100 | #287 | Tragic $74,279 |
| Immigrants | Central America | 0.1 /100 | #288 | Tragic $74,217 |
| Fijians | 0.1 /100 | #289 | Tragic $74,205 |
| Bangladeshis | 0.1 /100 | #290 | Tragic $74,112 |
| Hispanics or Latinos | 0.1 /100 | #291 | Tragic $73,823 |
| Comanche | 0.1 /100 | #292 | Tragic $73,747 |
| Immigrants | Cabo Verde | 0.1 /100 | #293 | Tragic $73,515 |
| Blackfeet | 0.1 /100 | #294 | Tragic $73,509 |
| Cubans | 0.1 /100 | #295 | Tragic $73,392 |
| Haitians | 0.1 /100 | #296 | Tragic $73,306 |
| Immigrants | Mexico | 0.0 /100 | #297 | Tragic $73,160 |
| Paiute | 0.0 /100 | #298 | Tragic $72,959 |