Immigrants from Bahamas vs Hispanic or Latino Unemployment Among Ages 16 to 19 years
COMPARE
Immigrants from Bahamas
Hispanic or Latino
Unemployment Among Ages 16 to 19 years
Unemployment Among Ages 16 to 19 years Comparison
Immigrants from Bahamas
Hispanics or Latinos
20.4%
UNEMPLOYMENT AMONG AGES 16 TO 19 YEARS
0.0/ 100
METRIC RATING
293rd/ 347
METRIC RANK
19.2%
UNEMPLOYMENT AMONG AGES 16 TO 19 YEARS
0.0/ 100
METRIC RATING
272nd/ 347
METRIC RANK
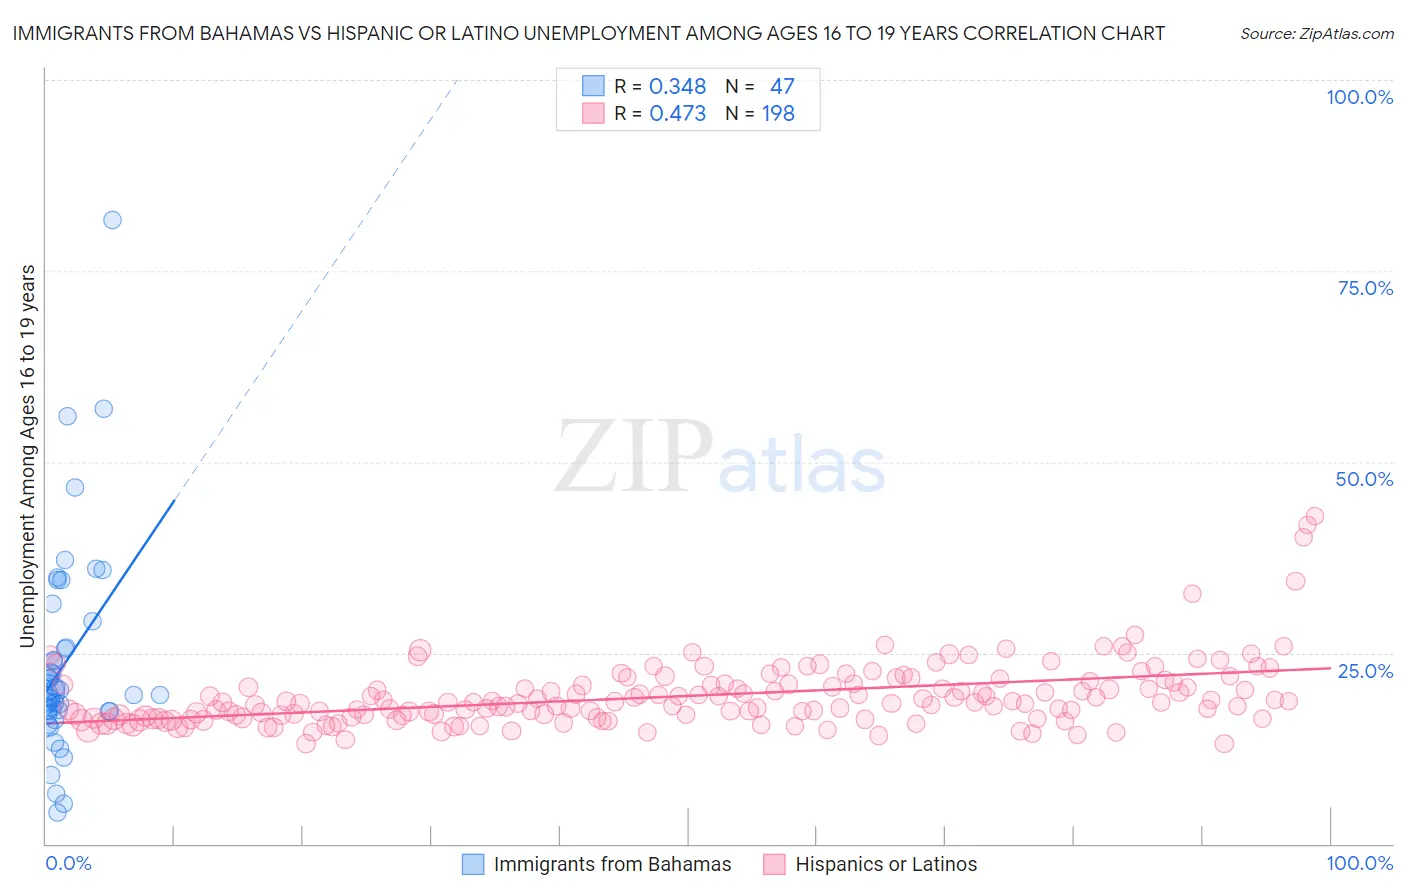
Immigrants from Bahamas vs Hispanic or Latino Unemployment Among Ages 16 to 19 years Correlation Chart
The statistical analysis conducted on geographies consisting of 102,900,667 people shows a mild positive correlation between the proportion of Immigrants from Bahamas and unemployment rate among population between the ages 16 and 19 in the United States with a correlation coefficient (R) of 0.348 and weighted average of 20.4%. Similarly, the statistical analysis conducted on geographies consisting of 510,884,853 people shows a moderate positive correlation between the proportion of Hispanics or Latinos and unemployment rate among population between the ages 16 and 19 in the United States with a correlation coefficient (R) of 0.473 and weighted average of 19.2%, a difference of 5.9%.
Unemployment Among Ages 16 to 19 years Correlation Summary
| Measurement | Immigrants from Bahamas | Hispanic or Latino |
| Minimum | 4.1% | 13.1% |
| Maximum | 81.7% | 42.9% |
| Range | 77.6% | 29.7% |
| Mean | 24.0% | 19.3% |
| Median | 19.8% | 18.4% |
| Interquartile 25% (IQ1) | 17.3% | 16.4% |
| Interquartile 75% (IQ3) | 29.2% | 20.9% |
| Interquartile Range (IQR) | 11.9% | 4.4% |
| Standard Deviation (Sample) | 14.2% | 4.4% |
| Standard Deviation (Population) | 14.0% | 4.4% |
Similar Demographics by Unemployment Among Ages 16 to 19 years
Demographics Similar to Immigrants from Bahamas by Unemployment Among Ages 16 to 19 years
In terms of unemployment among ages 16 to 19 years, the demographic groups most similar to Immigrants from Bahamas are Immigrants from Haiti (20.4%, a difference of 0.26%), Central American Indian (20.4%, a difference of 0.32%), Armenian (20.5%, a difference of 0.61%), Comanche (20.2%, a difference of 0.63%), and Alsatian (20.5%, a difference of 0.64%).
| Demographics | Rating | Rank | Unemployment Among Ages 16 to 19 years |
| Bahamians | 0.0 /100 | #286 | Tragic 19.8% |
| Immigrants | Ghana | 0.0 /100 | #287 | Tragic 19.8% |
| Immigrants | Azores | 0.0 /100 | #288 | Tragic 19.8% |
| Pueblo | 0.0 /100 | #289 | Tragic 19.8% |
| Immigrants | Sierra Leone | 0.0 /100 | #290 | Tragic 20.0% |
| Immigrants | Yemen | 0.0 /100 | #291 | Tragic 20.0% |
| Comanche | 0.0 /100 | #292 | Tragic 20.2% |
| Immigrants | Bahamas | 0.0 /100 | #293 | Tragic 20.4% |
| Immigrants | Haiti | 0.0 /100 | #294 | Tragic 20.4% |
| Central American Indians | 0.0 /100 | #295 | Tragic 20.4% |
| Armenians | 0.0 /100 | #296 | Tragic 20.5% |
| Alsatians | 0.0 /100 | #297 | Tragic 20.5% |
| Haitians | 0.0 /100 | #298 | Tragic 20.5% |
| Immigrants | Uzbekistan | 0.0 /100 | #299 | Tragic 20.5% |
| Ecuadorians | 0.0 /100 | #300 | Tragic 20.5% |
Demographics Similar to Hispanics or Latinos by Unemployment Among Ages 16 to 19 years
In terms of unemployment among ages 16 to 19 years, the demographic groups most similar to Hispanics or Latinos are Blackfeet (19.2%, a difference of 0.12%), Immigrants from Panama (19.3%, a difference of 0.13%), Shoshone (19.3%, a difference of 0.28%), Honduran (19.2%, a difference of 0.50%), and Paraguayan (19.4%, a difference of 0.60%).
| Demographics | Rating | Rank | Unemployment Among Ages 16 to 19 years |
| Choctaw | 0.1 /100 | #265 | Tragic 19.0% |
| Immigrants | Honduras | 0.1 /100 | #266 | Tragic 19.0% |
| Israelis | 0.1 /100 | #267 | Tragic 19.0% |
| Immigrants | El Salvador | 0.1 /100 | #268 | Tragic 19.1% |
| Lumbee | 0.1 /100 | #269 | Tragic 19.1% |
| Hondurans | 0.1 /100 | #270 | Tragic 19.2% |
| Blackfeet | 0.0 /100 | #271 | Tragic 19.2% |
| Hispanics or Latinos | 0.0 /100 | #272 | Tragic 19.2% |
| Immigrants | Panama | 0.0 /100 | #273 | Tragic 19.3% |
| Shoshone | 0.0 /100 | #274 | Tragic 19.3% |
| Paraguayans | 0.0 /100 | #275 | Tragic 19.4% |
| Immigrants | Latin America | 0.0 /100 | #276 | Tragic 19.4% |
| Immigrants | Western Africa | 0.0 /100 | #277 | Tragic 19.4% |
| Africans | 0.0 /100 | #278 | Tragic 19.5% |
| Ute | 0.0 /100 | #279 | Tragic 19.6% |