Brazilian vs Hispanic or Latino Median Household Income
COMPARE
Brazilian
Hispanic or Latino
Median Household Income
Median Household Income Comparison
Brazilians
Hispanics or Latinos
$88,934
MEDIAN HOUSEHOLD INCOME
92.1/ 100
METRIC RATING
129th/ 347
METRIC RANK
$73,823
MEDIAN HOUSEHOLD INCOME
0.1/ 100
METRIC RATING
291st/ 347
METRIC RANK
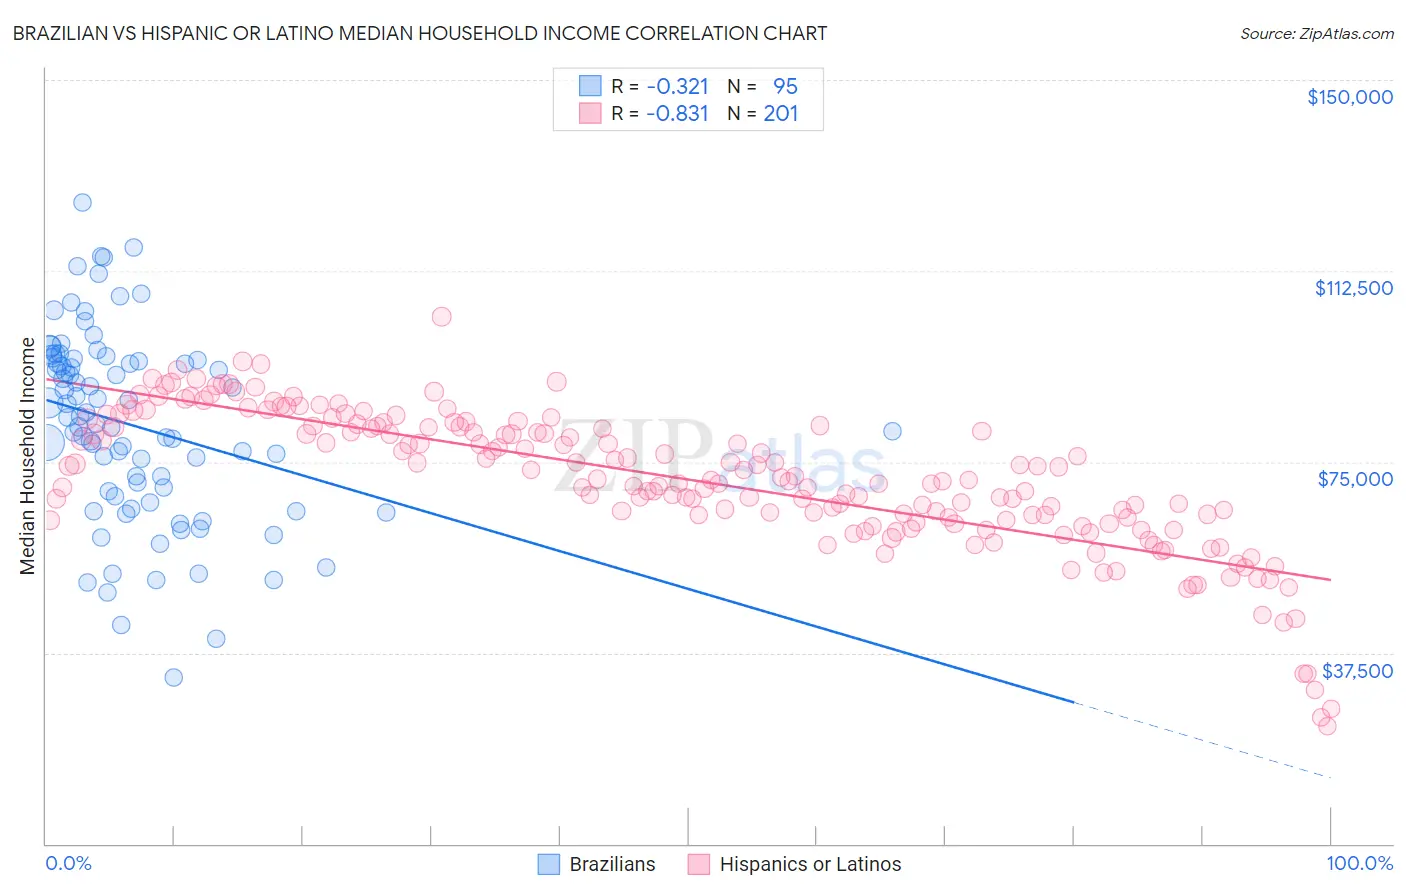
Brazilian vs Hispanic or Latino Median Household Income Correlation Chart
The statistical analysis conducted on geographies consisting of 323,646,187 people shows a mild negative correlation between the proportion of Brazilians and median household income in the United States with a correlation coefficient (R) of -0.321 and weighted average of $88,934. Similarly, the statistical analysis conducted on geographies consisting of 577,204,907 people shows a very strong negative correlation between the proportion of Hispanics or Latinos and median household income in the United States with a correlation coefficient (R) of -0.831 and weighted average of $73,823, a difference of 20.5%.
Median Household Income Correlation Summary
| Measurement | Brazilian | Hispanic or Latino |
| Minimum | $32,591 | $23,087 |
| Maximum | $126,001 | $103,536 |
| Range | $93,410 | $80,449 |
| Mean | $82,158 | $71,424 |
| Median | $83,690 | $71,562 |
| Interquartile 25% (IQ1) | $68,333 | $63,567 |
| Interquartile 75% (IQ3) | $94,909 | $81,961 |
| Interquartile Range (IQR) | $26,576 | $18,394 |
| Standard Deviation (Sample) | $18,705 | $13,788 |
| Standard Deviation (Population) | $18,606 | $13,754 |
Similar Demographics by Median Household Income
Demographics Similar to Brazilians by Median Household Income
In terms of median household income, the demographic groups most similar to Brazilians are British ($88,914, a difference of 0.020%), Portuguese ($88,976, a difference of 0.050%), Immigrants from Peru ($89,010, a difference of 0.090%), Immigrants from Syria ($88,792, a difference of 0.16%), and Immigrants from Oceania ($89,100, a difference of 0.19%).
| Demographics | Rating | Rank | Median Household Income |
| Pakistanis | 94.8 /100 | #122 | Exceptional $89,638 |
| Immigrants | Zimbabwe | 94.4 /100 | #123 | Exceptional $89,496 |
| Immigrants | Jordan | 94.1 /100 | #124 | Exceptional $89,412 |
| Immigrants | Kuwait | 93.5 /100 | #125 | Exceptional $89,263 |
| Immigrants | Oceania | 92.9 /100 | #126 | Exceptional $89,100 |
| Immigrants | Peru | 92.5 /100 | #127 | Exceptional $89,010 |
| Portuguese | 92.3 /100 | #128 | Exceptional $88,976 |
| Brazilians | 92.1 /100 | #129 | Exceptional $88,934 |
| British | 92.0 /100 | #130 | Exceptional $88,914 |
| Immigrants | Syria | 91.4 /100 | #131 | Exceptional $88,792 |
| Europeans | 91.2 /100 | #132 | Exceptional $88,751 |
| Immigrants | Ethiopia | 90.9 /100 | #133 | Exceptional $88,687 |
| Swedes | 90.0 /100 | #134 | Exceptional $88,524 |
| Immigrants | Sierra Leone | 89.9 /100 | #135 | Excellent $88,498 |
| Poles | 89.7 /100 | #136 | Excellent $88,472 |
Demographics Similar to Hispanics or Latinos by Median Household Income
In terms of median household income, the demographic groups most similar to Hispanics or Latinos are Comanche ($73,747, a difference of 0.10%), Bangladeshi ($74,112, a difference of 0.39%), Immigrants from Cabo Verde ($73,515, a difference of 0.42%), Blackfeet ($73,509, a difference of 0.43%), and Fijian ($74,205, a difference of 0.52%).
| Demographics | Rating | Rank | Median Household Income |
| Yaqui | 0.1 /100 | #284 | Tragic $74,596 |
| Mexicans | 0.1 /100 | #285 | Tragic $74,399 |
| Immigrants | Somalia | 0.1 /100 | #286 | Tragic $74,300 |
| Iroquois | 0.1 /100 | #287 | Tragic $74,279 |
| Immigrants | Central America | 0.1 /100 | #288 | Tragic $74,217 |
| Fijians | 0.1 /100 | #289 | Tragic $74,205 |
| Bangladeshis | 0.1 /100 | #290 | Tragic $74,112 |
| Hispanics or Latinos | 0.1 /100 | #291 | Tragic $73,823 |
| Comanche | 0.1 /100 | #292 | Tragic $73,747 |
| Immigrants | Cabo Verde | 0.1 /100 | #293 | Tragic $73,515 |
| Blackfeet | 0.1 /100 | #294 | Tragic $73,509 |
| Cubans | 0.1 /100 | #295 | Tragic $73,392 |
| Haitians | 0.1 /100 | #296 | Tragic $73,306 |
| Immigrants | Mexico | 0.0 /100 | #297 | Tragic $73,160 |
| Paiute | 0.0 /100 | #298 | Tragic $72,959 |