Immigrants from Bahamas vs Honduran Median Household Income
COMPARE
Immigrants from Bahamas
Honduran
Median Household Income
Median Household Income Comparison
Immigrants from Bahamas
Hondurans
$71,349
MEDIAN HOUSEHOLD INCOME
0.0/ 100
METRIC RATING
313th/ 347
METRIC RANK
$72,588
MEDIAN HOUSEHOLD INCOME
0.0/ 100
METRIC RATING
305th/ 347
METRIC RANK
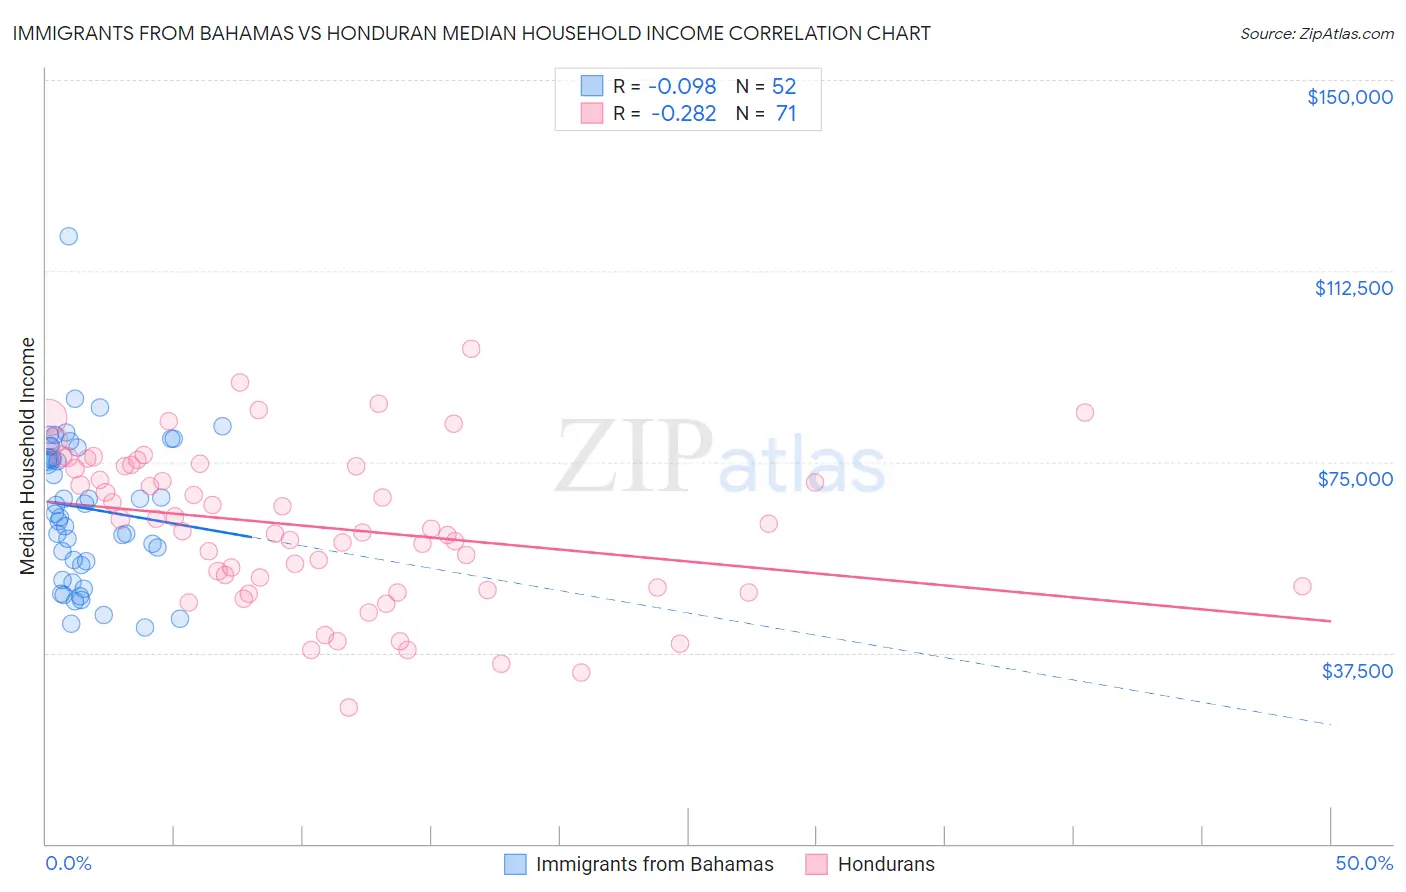
Immigrants from Bahamas vs Honduran Median Household Income Correlation Chart
The statistical analysis conducted on geographies consisting of 104,583,931 people shows a slight negative correlation between the proportion of Immigrants from Bahamas and median household income in the United States with a correlation coefficient (R) of -0.098 and weighted average of $71,349. Similarly, the statistical analysis conducted on geographies consisting of 357,531,795 people shows a weak negative correlation between the proportion of Hondurans and median household income in the United States with a correlation coefficient (R) of -0.282 and weighted average of $72,588, a difference of 1.7%.
Median Household Income Correlation Summary
| Measurement | Immigrants from Bahamas | Honduran |
| Minimum | $42,496 | $26,822 |
| Maximum | $119,201 | $97,304 |
| Range | $76,705 | $70,482 |
| Mean | $65,863 | $62,141 |
| Median | $65,628 | $61,786 |
| Interquartile 25% (IQ1) | $55,065 | $50,302 |
| Interquartile 75% (IQ3) | $76,891 | $74,115 |
| Interquartile Range (IQR) | $21,825 | $23,813 |
| Standard Deviation (Sample) | $14,679 | $15,104 |
| Standard Deviation (Population) | $14,537 | $14,997 |
Demographics Similar to Immigrants from Bahamas and Hondurans by Median Household Income
In terms of median household income, the demographic groups most similar to Immigrants from Bahamas are Dominican ($71,302, a difference of 0.060%), Immigrants from Honduras ($71,452, a difference of 0.15%), Ottawa ($70,984, a difference of 0.51%), Apache ($70,927, a difference of 0.59%), and Immigrants from Zaire ($71,801, a difference of 0.63%). Similarly, the demographic groups most similar to Hondurans are Immigrants from Haiti ($72,599, a difference of 0.020%), Potawatomi ($72,576, a difference of 0.020%), African ($72,650, a difference of 0.090%), Shoshone ($72,660, a difference of 0.10%), and Cherokee ($72,682, a difference of 0.13%).
| Demographics | Rating | Rank | Median Household Income |
| Indonesians | 0.0 /100 | #299 | Tragic $72,856 |
| Immigrants | Dominica | 0.0 /100 | #300 | Tragic $72,760 |
| Cherokee | 0.0 /100 | #301 | Tragic $72,682 |
| Shoshone | 0.0 /100 | #302 | Tragic $72,660 |
| Africans | 0.0 /100 | #303 | Tragic $72,650 |
| Immigrants | Haiti | 0.0 /100 | #304 | Tragic $72,599 |
| Hondurans | 0.0 /100 | #305 | Tragic $72,588 |
| Potawatomi | 0.0 /100 | #306 | Tragic $72,576 |
| Ute | 0.0 /100 | #307 | Tragic $72,402 |
| Yakama | 0.0 /100 | #308 | Tragic $72,225 |
| Immigrants | Caribbean | 0.0 /100 | #309 | Tragic $71,860 |
| U.S. Virgin Islanders | 0.0 /100 | #310 | Tragic $71,853 |
| Immigrants | Zaire | 0.0 /100 | #311 | Tragic $71,801 |
| Immigrants | Honduras | 0.0 /100 | #312 | Tragic $71,452 |
| Immigrants | Bahamas | 0.0 /100 | #313 | Tragic $71,349 |
| Dominicans | 0.0 /100 | #314 | Tragic $71,302 |
| Ottawa | 0.0 /100 | #315 | Tragic $70,984 |
| Apache | 0.0 /100 | #316 | Tragic $70,927 |
| Cajuns | 0.0 /100 | #317 | Tragic $70,605 |
| Chippewa | 0.0 /100 | #318 | Tragic $70,539 |
| Immigrants | Dominican Republic | 0.0 /100 | #319 | Tragic $70,208 |