Immigrants from Bahamas vs Immigrants from Jamaica Median Household Income
COMPARE
Immigrants from Bahamas
Immigrants from Jamaica
Median Household Income
Median Household Income Comparison
Immigrants from Bahamas
Immigrants from Jamaica
$71,349
MEDIAN HOUSEHOLD INCOME
0.0/ 100
METRIC RATING
313th/ 347
METRIC RANK
$75,851
MEDIAN HOUSEHOLD INCOME
0.3/ 100
METRIC RATING
268th/ 347
METRIC RANK
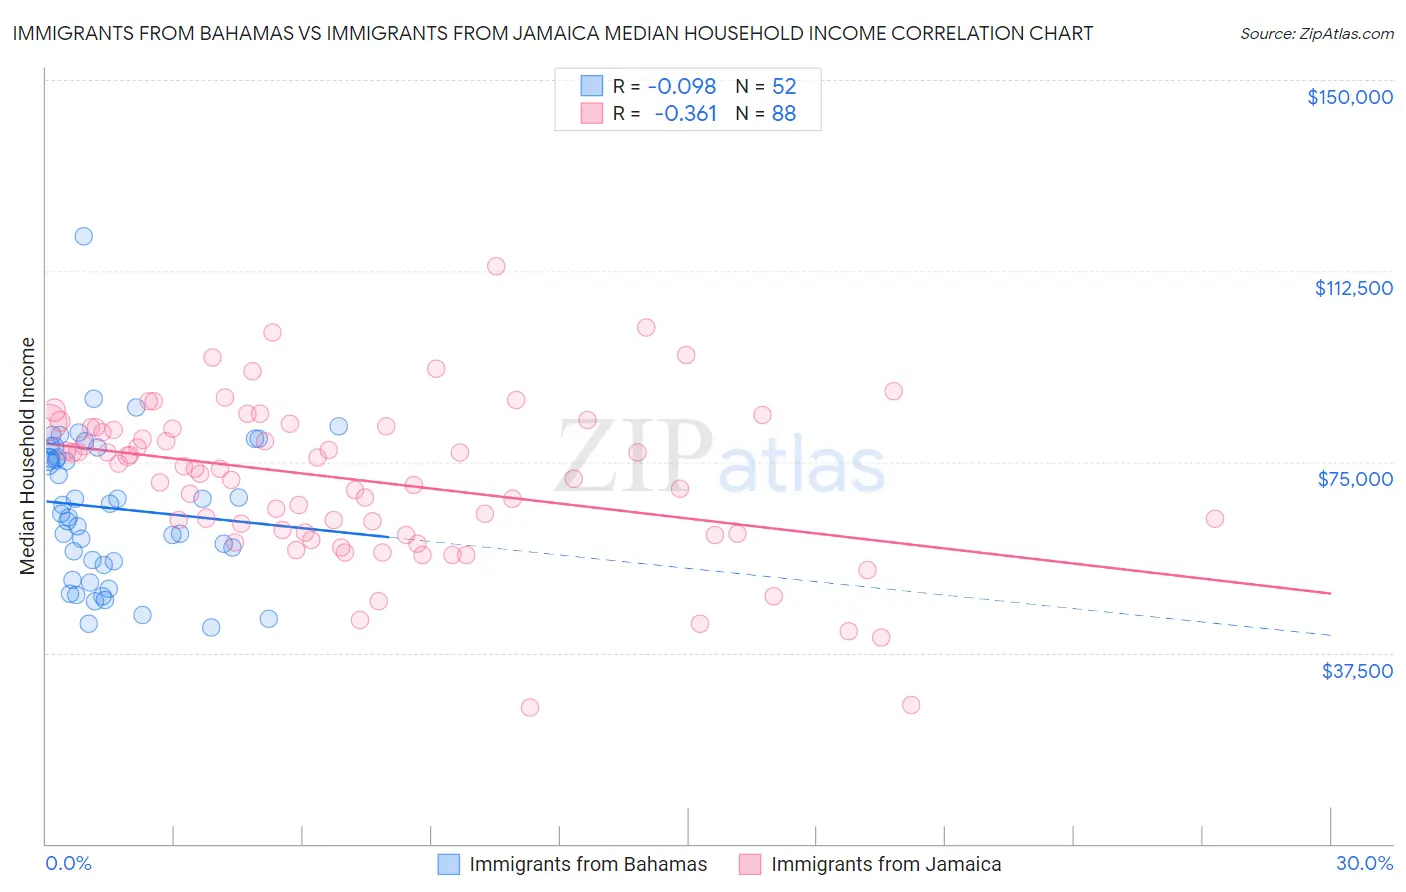
Immigrants from Bahamas vs Immigrants from Jamaica Median Household Income Correlation Chart
The statistical analysis conducted on geographies consisting of 104,583,931 people shows a slight negative correlation between the proportion of Immigrants from Bahamas and median household income in the United States with a correlation coefficient (R) of -0.098 and weighted average of $71,349. Similarly, the statistical analysis conducted on geographies consisting of 301,517,769 people shows a mild negative correlation between the proportion of Immigrants from Jamaica and median household income in the United States with a correlation coefficient (R) of -0.361 and weighted average of $75,851, a difference of 6.3%.
Median Household Income Correlation Summary
| Measurement | Immigrants from Bahamas | Immigrants from Jamaica |
| Minimum | $42,496 | $26,823 |
| Maximum | $119,201 | $113,462 |
| Range | $76,705 | $86,639 |
| Mean | $65,863 | $71,387 |
| Median | $65,628 | $73,716 |
| Interquartile 25% (IQ1) | $55,065 | $60,983 |
| Interquartile 75% (IQ3) | $76,891 | $81,782 |
| Interquartile Range (IQR) | $21,825 | $20,798 |
| Standard Deviation (Sample) | $14,679 | $15,538 |
| Standard Deviation (Population) | $14,537 | $15,449 |
Similar Demographics by Median Household Income
Demographics Similar to Immigrants from Bahamas by Median Household Income
In terms of median household income, the demographic groups most similar to Immigrants from Bahamas are Dominican ($71,302, a difference of 0.060%), Immigrants from Honduras ($71,452, a difference of 0.15%), Ottawa ($70,984, a difference of 0.51%), Apache ($70,927, a difference of 0.59%), and Immigrants from Zaire ($71,801, a difference of 0.63%).
| Demographics | Rating | Rank | Median Household Income |
| Potawatomi | 0.0 /100 | #306 | Tragic $72,576 |
| Ute | 0.0 /100 | #307 | Tragic $72,402 |
| Yakama | 0.0 /100 | #308 | Tragic $72,225 |
| Immigrants | Caribbean | 0.0 /100 | #309 | Tragic $71,860 |
| U.S. Virgin Islanders | 0.0 /100 | #310 | Tragic $71,853 |
| Immigrants | Zaire | 0.0 /100 | #311 | Tragic $71,801 |
| Immigrants | Honduras | 0.0 /100 | #312 | Tragic $71,452 |
| Immigrants | Bahamas | 0.0 /100 | #313 | Tragic $71,349 |
| Dominicans | 0.0 /100 | #314 | Tragic $71,302 |
| Ottawa | 0.0 /100 | #315 | Tragic $70,984 |
| Apache | 0.0 /100 | #316 | Tragic $70,927 |
| Cajuns | 0.0 /100 | #317 | Tragic $70,605 |
| Chippewa | 0.0 /100 | #318 | Tragic $70,539 |
| Immigrants | Dominican Republic | 0.0 /100 | #319 | Tragic $70,208 |
| Colville | 0.0 /100 | #320 | Tragic $70,094 |
Demographics Similar to Immigrants from Jamaica by Median Household Income
In terms of median household income, the demographic groups most similar to Immigrants from Jamaica are Cape Verdean ($75,848, a difference of 0.0%), German Russian ($75,856, a difference of 0.010%), Hmong ($75,839, a difference of 0.020%), Pennsylvania German ($75,814, a difference of 0.050%), and Somali ($75,782, a difference of 0.090%).
| Demographics | Rating | Rank | Median Household Income |
| Immigrants | Grenada | 0.4 /100 | #261 | Tragic $76,517 |
| French American Indians | 0.4 /100 | #262 | Tragic $76,387 |
| Alaskan Athabascans | 0.4 /100 | #263 | Tragic $76,383 |
| Guatemalans | 0.3 /100 | #264 | Tragic $75,961 |
| Immigrants | Belize | 0.3 /100 | #265 | Tragic $75,938 |
| Americans | 0.3 /100 | #266 | Tragic $75,932 |
| German Russians | 0.3 /100 | #267 | Tragic $75,856 |
| Immigrants | Jamaica | 0.3 /100 | #268 | Tragic $75,851 |
| Cape Verdeans | 0.3 /100 | #269 | Tragic $75,848 |
| Hmong | 0.3 /100 | #270 | Tragic $75,839 |
| Pennsylvania Germans | 0.3 /100 | #271 | Tragic $75,814 |
| Somalis | 0.3 /100 | #272 | Tragic $75,782 |
| Liberians | 0.2 /100 | #273 | Tragic $75,667 |
| British West Indians | 0.2 /100 | #274 | Tragic $75,647 |
| Immigrants | Micronesia | 0.2 /100 | #275 | Tragic $75,574 |