Arapaho vs Hispanic or Latino Median Household Income
COMPARE
Arapaho
Hispanic or Latino
Median Household Income
Median Household Income Comparison
Arapaho
Hispanics or Latinos
$67,965
MEDIAN HOUSEHOLD INCOME
0.0/ 100
METRIC RATING
330th/ 347
METRIC RANK
$73,823
MEDIAN HOUSEHOLD INCOME
0.1/ 100
METRIC RATING
291st/ 347
METRIC RANK
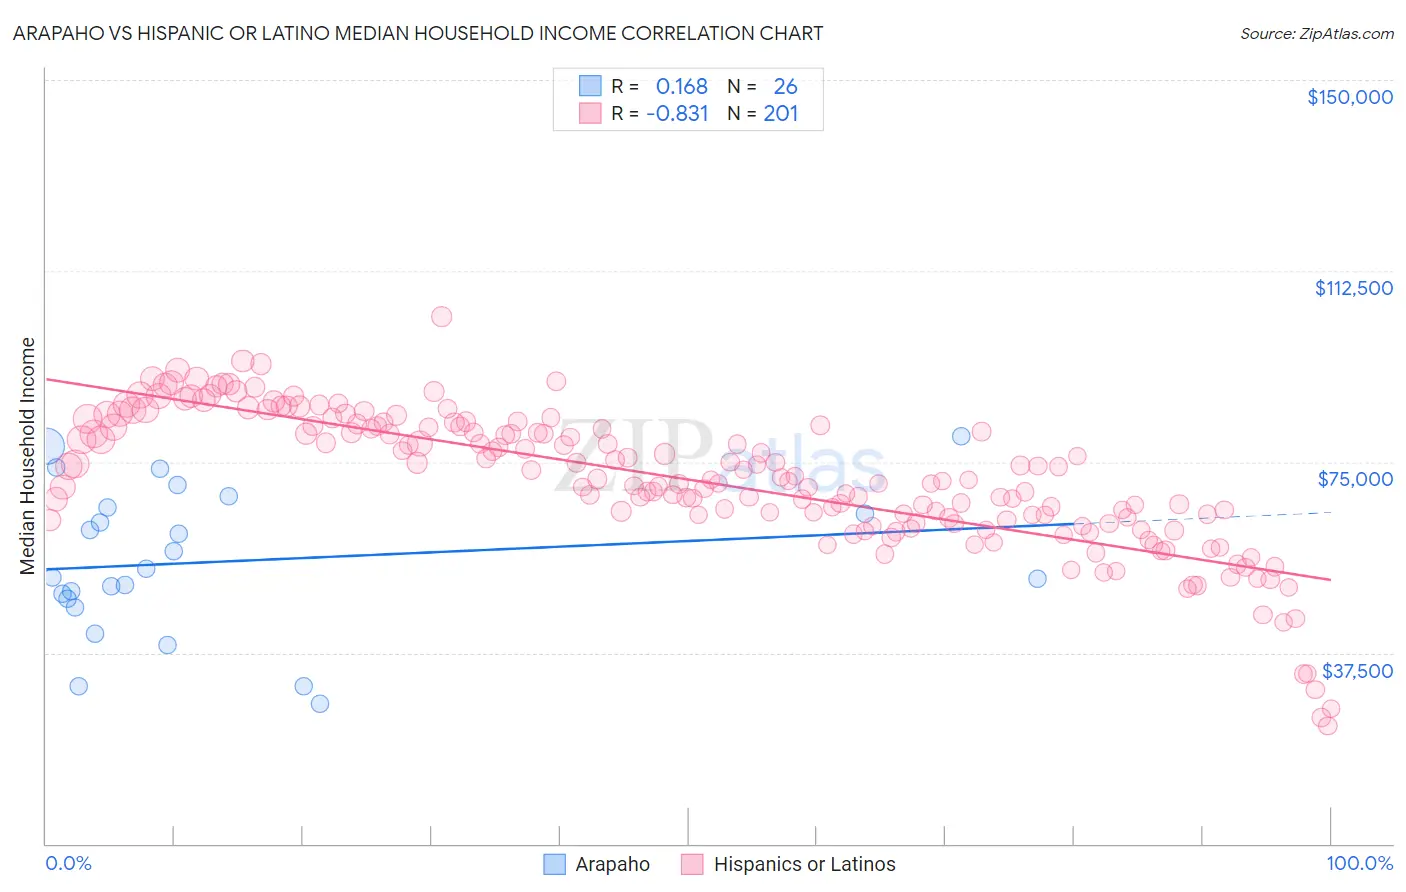
Arapaho vs Hispanic or Latino Median Household Income Correlation Chart
The statistical analysis conducted on geographies consisting of 29,777,139 people shows a poor positive correlation between the proportion of Arapaho and median household income in the United States with a correlation coefficient (R) of 0.168 and weighted average of $67,965. Similarly, the statistical analysis conducted on geographies consisting of 577,204,907 people shows a very strong negative correlation between the proportion of Hispanics or Latinos and median household income in the United States with a correlation coefficient (R) of -0.831 and weighted average of $73,823, a difference of 8.6%.
Median Household Income Correlation Summary
| Measurement | Arapaho | Hispanic or Latino |
| Minimum | $27,500 | $23,087 |
| Maximum | $80,000 | $103,536 |
| Range | $52,500 | $80,449 |
| Mean | $55,430 | $71,424 |
| Median | $53,182 | $71,562 |
| Interquartile 25% (IQ1) | $47,998 | $63,567 |
| Interquartile 75% (IQ3) | $66,111 | $81,961 |
| Interquartile Range (IQR) | $18,113 | $18,394 |
| Standard Deviation (Sample) | $14,479 | $13,788 |
| Standard Deviation (Population) | $14,198 | $13,754 |
Similar Demographics by Median Household Income
Demographics Similar to Arapaho by Median Household Income
In terms of median household income, the demographic groups most similar to Arapaho are Native/Alaskan ($67,879, a difference of 0.13%), Sioux ($67,792, a difference of 0.25%), Creek ($67,715, a difference of 0.37%), Black/African American ($67,573, a difference of 0.58%), and Dutch West Indian ($68,412, a difference of 0.66%).
| Demographics | Rating | Rank | Median Household Income |
| Bahamians | 0.0 /100 | #323 | Tragic $69,726 |
| Yup'ik | 0.0 /100 | #324 | Tragic $69,695 |
| Seminole | 0.0 /100 | #325 | Tragic $69,420 |
| Yuman | 0.0 /100 | #326 | Tragic $68,743 |
| Immigrants | Cuba | 0.0 /100 | #327 | Tragic $68,461 |
| Menominee | 0.0 /100 | #328 | Tragic $68,423 |
| Dutch West Indians | 0.0 /100 | #329 | Tragic $68,412 |
| Arapaho | 0.0 /100 | #330 | Tragic $67,965 |
| Natives/Alaskans | 0.0 /100 | #331 | Tragic $67,879 |
| Sioux | 0.0 /100 | #332 | Tragic $67,792 |
| Creek | 0.0 /100 | #333 | Tragic $67,715 |
| Blacks/African Americans | 0.0 /100 | #334 | Tragic $67,573 |
| Cheyenne | 0.0 /100 | #335 | Tragic $66,974 |
| Immigrants | Congo | 0.0 /100 | #336 | Tragic $66,768 |
| Kiowa | 0.0 /100 | #337 | Tragic $65,914 |
Demographics Similar to Hispanics or Latinos by Median Household Income
In terms of median household income, the demographic groups most similar to Hispanics or Latinos are Comanche ($73,747, a difference of 0.10%), Bangladeshi ($74,112, a difference of 0.39%), Immigrants from Cabo Verde ($73,515, a difference of 0.42%), Blackfeet ($73,509, a difference of 0.43%), and Fijian ($74,205, a difference of 0.52%).
| Demographics | Rating | Rank | Median Household Income |
| Yaqui | 0.1 /100 | #284 | Tragic $74,596 |
| Mexicans | 0.1 /100 | #285 | Tragic $74,399 |
| Immigrants | Somalia | 0.1 /100 | #286 | Tragic $74,300 |
| Iroquois | 0.1 /100 | #287 | Tragic $74,279 |
| Immigrants | Central America | 0.1 /100 | #288 | Tragic $74,217 |
| Fijians | 0.1 /100 | #289 | Tragic $74,205 |
| Bangladeshis | 0.1 /100 | #290 | Tragic $74,112 |
| Hispanics or Latinos | 0.1 /100 | #291 | Tragic $73,823 |
| Comanche | 0.1 /100 | #292 | Tragic $73,747 |
| Immigrants | Cabo Verde | 0.1 /100 | #293 | Tragic $73,515 |
| Blackfeet | 0.1 /100 | #294 | Tragic $73,509 |
| Cubans | 0.1 /100 | #295 | Tragic $73,392 |
| Haitians | 0.1 /100 | #296 | Tragic $73,306 |
| Immigrants | Mexico | 0.0 /100 | #297 | Tragic $73,160 |
| Paiute | 0.0 /100 | #298 | Tragic $72,959 |