Filipino vs Immigrants from Brazil Per Capita Income
COMPARE
Filipino
Immigrants from Brazil
Per Capita Income
Per Capita Income Comparison
Filipinos
Immigrants from Brazil
$59,066
PER CAPITA INCOME
100.0/ 100
METRIC RATING
1st/ 347
METRIC RANK
$48,164
PER CAPITA INCOME
99.4/ 100
METRIC RATING
83rd/ 347
METRIC RANK
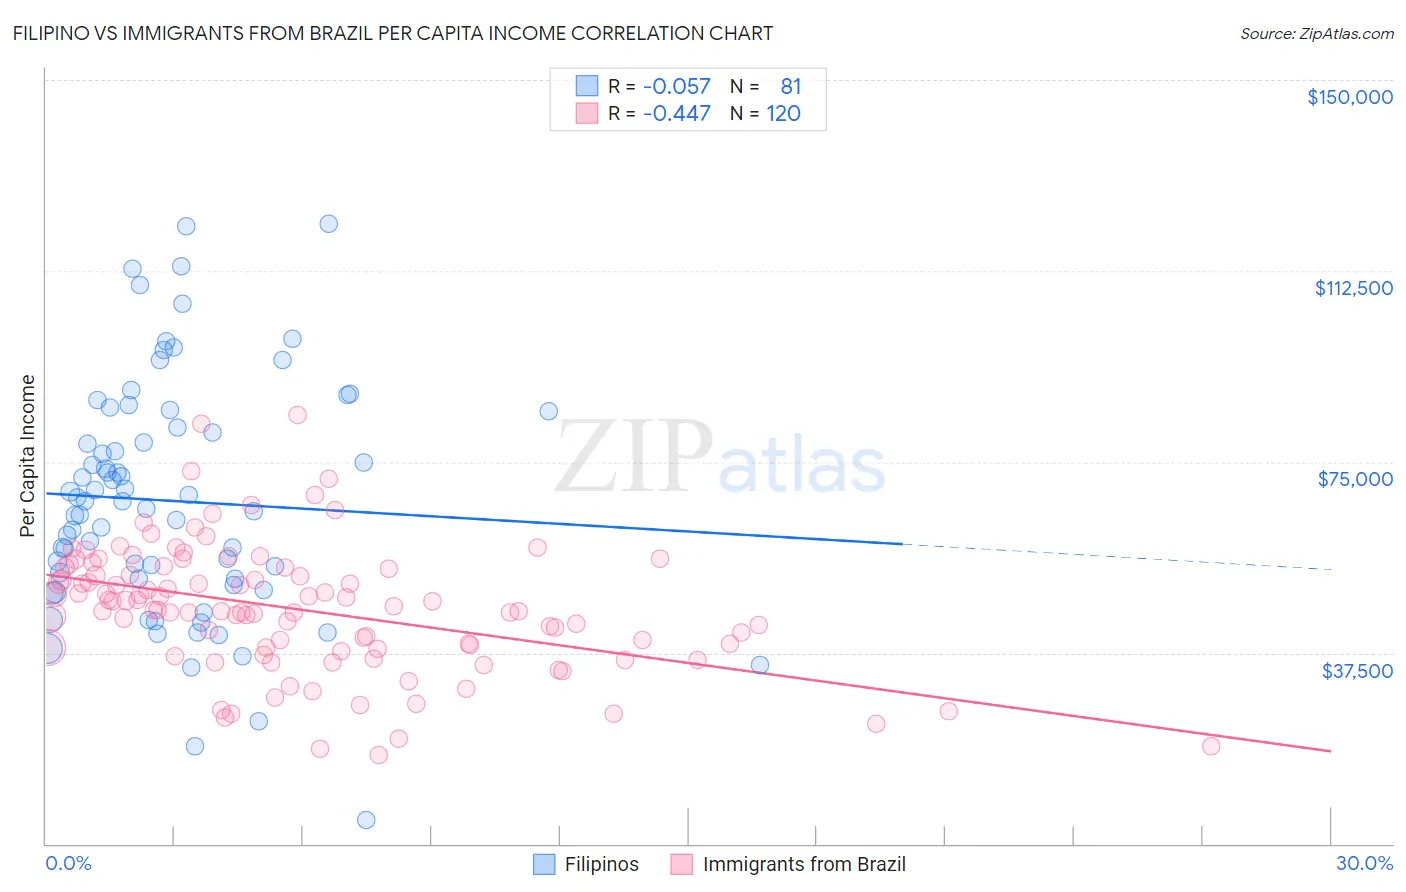
Filipino vs Immigrants from Brazil Per Capita Income Correlation Chart
The statistical analysis conducted on geographies consisting of 254,359,894 people shows a slight negative correlation between the proportion of Filipinos and per capita income in the United States with a correlation coefficient (R) of -0.057 and weighted average of $59,066. Similarly, the statistical analysis conducted on geographies consisting of 343,026,133 people shows a moderate negative correlation between the proportion of Immigrants from Brazil and per capita income in the United States with a correlation coefficient (R) of -0.447 and weighted average of $48,164, a difference of 22.6%.
Per Capita Income Correlation Summary
| Measurement | Filipino | Immigrants from Brazil |
| Minimum | $4,657 | $17,376 |
| Maximum | $121,798 | $84,094 |
| Range | $117,141 | $66,718 |
| Mean | $67,314 | $46,035 |
| Median | $67,249 | $45,902 |
| Interquartile 25% (IQ1) | $51,364 | $38,349 |
| Interquartile 75% (IQ3) | $83,421 | $54,171 |
| Interquartile Range (IQR) | $32,057 | $15,822 |
| Standard Deviation (Sample) | $23,294 | $12,485 |
| Standard Deviation (Population) | $23,149 | $12,433 |
Similar Demographics by Per Capita Income
Demographics Similar to Filipinos by Per Capita Income
In terms of per capita income, the demographic groups most similar to Filipinos are Iranian ($58,786, a difference of 0.48%), Immigrants from Singapore ($58,353, a difference of 1.2%), Immigrants from Australia ($57,953, a difference of 1.9%), Immigrants from Iran ($57,759, a difference of 2.3%), and Immigrants from Taiwan ($57,742, a difference of 2.3%).
| Demographics | Rating | Rank | Per Capita Income |
| Filipinos | 100.0 /100 | #1 | Exceptional $59,066 |
| Iranians | 100.0 /100 | #2 | Exceptional $58,786 |
| Immigrants | Singapore | 100.0 /100 | #3 | Exceptional $58,353 |
| Immigrants | Australia | 100.0 /100 | #4 | Exceptional $57,953 |
| Immigrants | Iran | 100.0 /100 | #5 | Exceptional $57,759 |
| Immigrants | Taiwan | 100.0 /100 | #6 | Exceptional $57,742 |
| Immigrants | Israel | 100.0 /100 | #7 | Exceptional $57,384 |
| Immigrants | Hong Kong | 100.0 /100 | #8 | Exceptional $56,709 |
| Immigrants | Ireland | 100.0 /100 | #9 | Exceptional $56,584 |
| Okinawans | 100.0 /100 | #10 | Exceptional $55,817 |
| Eastern Europeans | 100.0 /100 | #11 | Exceptional $55,780 |
| Immigrants | Sweden | 100.0 /100 | #12 | Exceptional $55,582 |
| Immigrants | India | 100.0 /100 | #13 | Exceptional $55,268 |
| Immigrants | Belgium | 100.0 /100 | #14 | Exceptional $55,082 |
| Cypriots | 100.0 /100 | #15 | Exceptional $54,899 |
Demographics Similar to Immigrants from Brazil by Per Capita Income
In terms of per capita income, the demographic groups most similar to Immigrants from Brazil are Immigrants from Indonesia ($48,195, a difference of 0.060%), Immigrants from Ukraine ($48,134, a difference of 0.060%), Austrian ($48,116, a difference of 0.10%), Armenian ($48,287, a difference of 0.26%), and Immigrants from Southern Europe ($48,027, a difference of 0.29%).
| Demographics | Rating | Rank | Per Capita Income |
| Immigrants | England | 99.7 /100 | #76 | Exceptional $48,844 |
| Immigrants | Kazakhstan | 99.7 /100 | #77 | Exceptional $48,747 |
| Immigrants | Italy | 99.6 /100 | #78 | Exceptional $48,654 |
| Romanians | 99.5 /100 | #79 | Exceptional $48,445 |
| Egyptians | 99.5 /100 | #80 | Exceptional $48,358 |
| Armenians | 99.4 /100 | #81 | Exceptional $48,287 |
| Immigrants | Indonesia | 99.4 /100 | #82 | Exceptional $48,195 |
| Immigrants | Brazil | 99.4 /100 | #83 | Exceptional $48,164 |
| Immigrants | Ukraine | 99.3 /100 | #84 | Exceptional $48,134 |
| Austrians | 99.3 /100 | #85 | Exceptional $48,116 |
| Immigrants | Southern Europe | 99.3 /100 | #86 | Exceptional $48,027 |
| Ukrainians | 99.3 /100 | #87 | Exceptional $48,014 |
| Croatians | 99.0 /100 | #88 | Exceptional $47,742 |
| Northern Europeans | 98.9 /100 | #89 | Exceptional $47,698 |
| Italians | 98.8 /100 | #90 | Exceptional $47,574 |