Colville vs Sierra Leonean Per Capita Income
COMPARE
Colville
Sierra Leonean
Per Capita Income
Per Capita Income Comparison
Colville
Sierra Leoneans
$38,047
PER CAPITA INCOME
0.2/ 100
METRIC RATING
279th/ 347
METRIC RANK
$43,405
PER CAPITA INCOME
42.9/ 100
METRIC RATING
180th/ 347
METRIC RANK
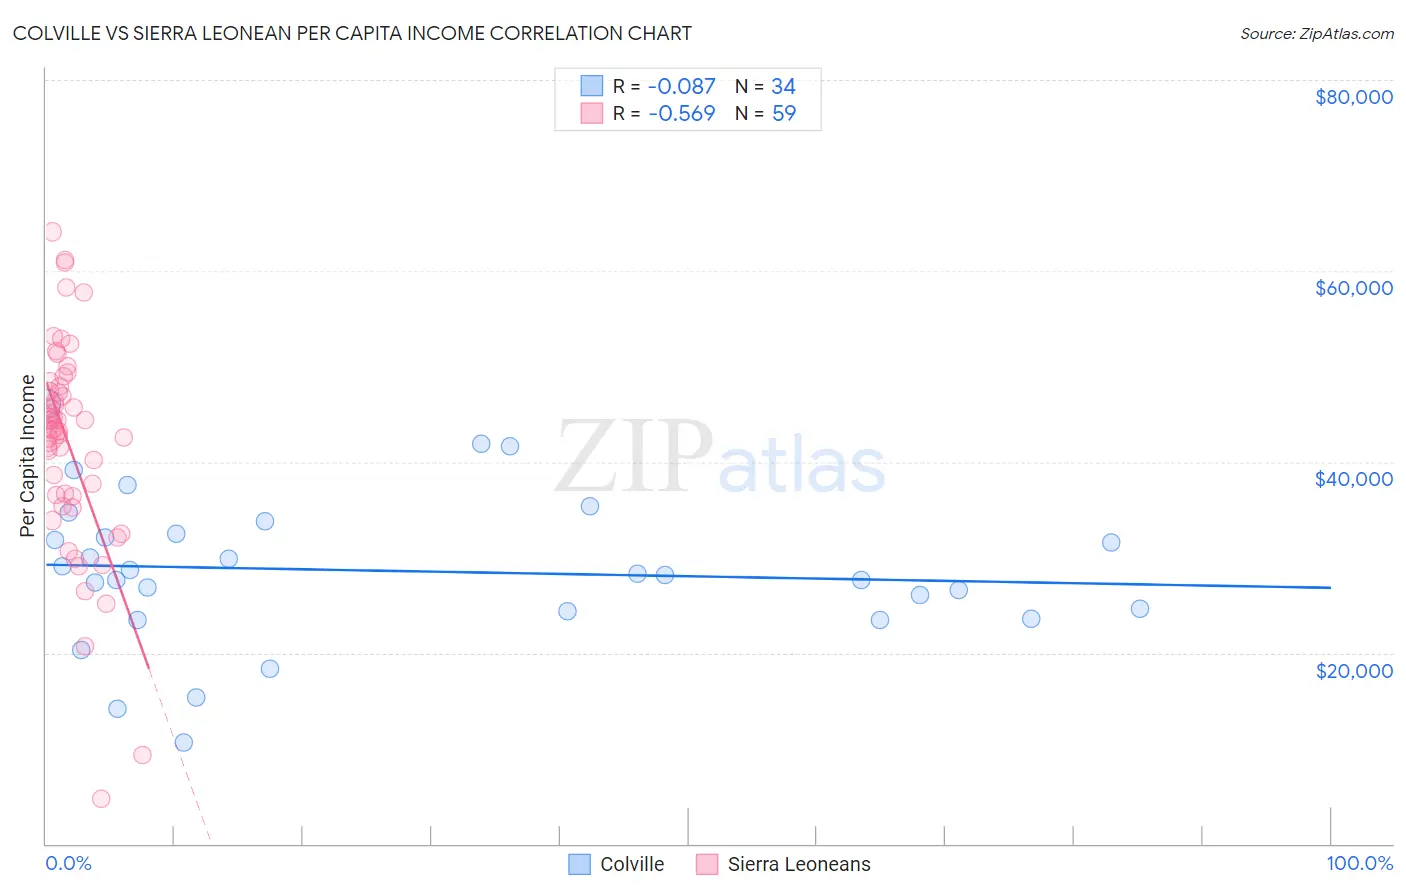
Colville vs Sierra Leonean Per Capita Income Correlation Chart
The statistical analysis conducted on geographies consisting of 34,687,707 people shows a slight negative correlation between the proportion of Colville and per capita income in the United States with a correlation coefficient (R) of -0.087 and weighted average of $38,047. Similarly, the statistical analysis conducted on geographies consisting of 83,350,653 people shows a substantial negative correlation between the proportion of Sierra Leoneans and per capita income in the United States with a correlation coefficient (R) of -0.569 and weighted average of $43,405, a difference of 14.1%.
Per Capita Income Correlation Summary
| Measurement | Colville | Sierra Leonean |
| Minimum | $10,541 | $4,657 |
| Maximum | $46,065 | $64,096 |
| Range | $35,524 | $59,439 |
| Mean | $28,594 | $41,867 |
| Median | $28,215 | $43,497 |
| Interquartile 25% (IQ1) | $24,418 | $36,386 |
| Interquartile 75% (IQ3) | $32,462 | $47,973 |
| Interquartile Range (IQR) | $8,044 | $11,587 |
| Standard Deviation (Sample) | $7,817 | $11,153 |
| Standard Deviation (Population) | $7,701 | $11,058 |
Similar Demographics by Per Capita Income
Demographics Similar to Colville by Per Capita Income
In terms of per capita income, the demographic groups most similar to Colville are Potawatomi ($38,046, a difference of 0.0%), Immigrants from Nicaragua ($38,065, a difference of 0.050%), Comanche ($38,088, a difference of 0.11%), Hmong ($38,120, a difference of 0.19%), and Immigrants from Dominica ($37,952, a difference of 0.25%).
| Demographics | Rating | Rank | Per Capita Income |
| Immigrants | Cabo Verde | 0.3 /100 | #272 | Tragic $38,540 |
| Nepalese | 0.3 /100 | #273 | Tragic $38,442 |
| Immigrants | El Salvador | 0.3 /100 | #274 | Tragic $38,394 |
| Immigrants | Liberia | 0.2 /100 | #275 | Tragic $38,165 |
| Hmong | 0.2 /100 | #276 | Tragic $38,120 |
| Comanche | 0.2 /100 | #277 | Tragic $38,088 |
| Immigrants | Nicaragua | 0.2 /100 | #278 | Tragic $38,065 |
| Colville | 0.2 /100 | #279 | Tragic $38,047 |
| Potawatomi | 0.2 /100 | #280 | Tragic $38,046 |
| Immigrants | Dominica | 0.2 /100 | #281 | Tragic $37,952 |
| Immigrants | Laos | 0.1 /100 | #282 | Tragic $37,857 |
| Pennsylvania Germans | 0.1 /100 | #283 | Tragic $37,842 |
| Africans | 0.1 /100 | #284 | Tragic $37,785 |
| Guatemalans | 0.1 /100 | #285 | Tragic $37,766 |
| Central American Indians | 0.1 /100 | #286 | Tragic $37,699 |
Demographics Similar to Sierra Leoneans by Per Capita Income
In terms of per capita income, the demographic groups most similar to Sierra Leoneans are Finnish ($43,461, a difference of 0.13%), Immigrants from Costa Rica ($43,464, a difference of 0.14%), Tlingit-Haida ($43,516, a difference of 0.25%), Immigrants from South Eastern Asia ($43,539, a difference of 0.31%), and Welsh ($43,233, a difference of 0.40%).
| Demographics | Rating | Rank | Per Capita Income |
| French | 50.7 /100 | #173 | Average $43,685 |
| Colombians | 50.0 /100 | #174 | Average $43,661 |
| Celtics | 48.9 /100 | #175 | Average $43,621 |
| Immigrants | South Eastern Asia | 46.6 /100 | #176 | Average $43,539 |
| Tlingit-Haida | 45.9 /100 | #177 | Average $43,516 |
| Immigrants | Costa Rica | 44.5 /100 | #178 | Average $43,464 |
| Finns | 44.4 /100 | #179 | Average $43,461 |
| Sierra Leoneans | 42.9 /100 | #180 | Average $43,405 |
| Welsh | 38.2 /100 | #181 | Fair $43,233 |
| Immigrants | Vietnam | 38.1 /100 | #182 | Fair $43,229 |
| Germans | 33.9 /100 | #183 | Fair $43,067 |
| Spaniards | 32.9 /100 | #184 | Fair $43,028 |
| Immigrants | Immigrants | 32.5 /100 | #185 | Fair $43,010 |
| French Canadians | 32.3 /100 | #186 | Fair $43,003 |
| Immigrants | Colombia | 31.5 /100 | #187 | Fair $42,971 |