Immigrants from Taiwan vs Sierra Leonean Per Capita Income
COMPARE
Immigrants from Taiwan
Sierra Leonean
Per Capita Income
Per Capita Income Comparison
Immigrants from Taiwan
Sierra Leoneans
$57,742
PER CAPITA INCOME
100.0/ 100
METRIC RATING
6th/ 347
METRIC RANK
$43,405
PER CAPITA INCOME
42.9/ 100
METRIC RATING
180th/ 347
METRIC RANK
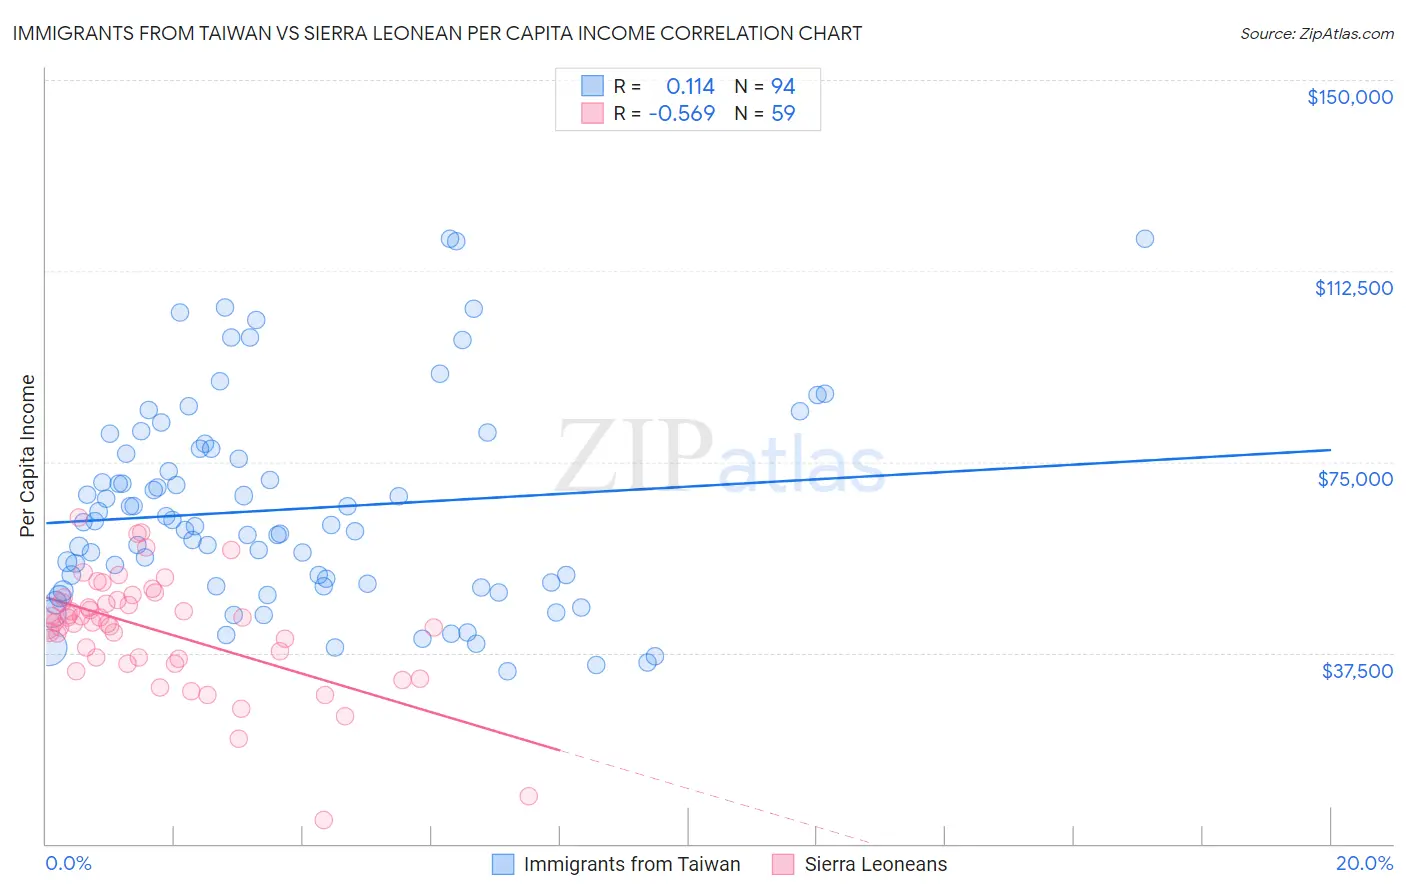
Immigrants from Taiwan vs Sierra Leonean Per Capita Income Correlation Chart
The statistical analysis conducted on geographies consisting of 298,270,368 people shows a poor positive correlation between the proportion of Immigrants from Taiwan and per capita income in the United States with a correlation coefficient (R) of 0.114 and weighted average of $57,742. Similarly, the statistical analysis conducted on geographies consisting of 83,350,653 people shows a substantial negative correlation between the proportion of Sierra Leoneans and per capita income in the United States with a correlation coefficient (R) of -0.569 and weighted average of $43,405, a difference of 33.0%.
Per Capita Income Correlation Summary
| Measurement | Immigrants from Taiwan | Sierra Leonean |
| Minimum | $33,786 | $4,657 |
| Maximum | $118,914 | $64,096 |
| Range | $85,128 | $59,439 |
| Mean | $65,673 | $41,867 |
| Median | $62,475 | $43,497 |
| Interquartile 25% (IQ1) | $50,616 | $36,386 |
| Interquartile 75% (IQ3) | $77,568 | $47,973 |
| Interquartile Range (IQR) | $26,952 | $11,587 |
| Standard Deviation (Sample) | $20,163 | $11,153 |
| Standard Deviation (Population) | $20,056 | $11,058 |
Similar Demographics by Per Capita Income
Demographics Similar to Immigrants from Taiwan by Per Capita Income
In terms of per capita income, the demographic groups most similar to Immigrants from Taiwan are Immigrants from Iran ($57,759, a difference of 0.030%), Immigrants from Australia ($57,953, a difference of 0.37%), Immigrants from Israel ($57,384, a difference of 0.62%), Immigrants from Singapore ($58,353, a difference of 1.1%), and Iranian ($58,786, a difference of 1.8%).
| Demographics | Rating | Rank | Per Capita Income |
| Filipinos | 100.0 /100 | #1 | Exceptional $59,066 |
| Iranians | 100.0 /100 | #2 | Exceptional $58,786 |
| Immigrants | Singapore | 100.0 /100 | #3 | Exceptional $58,353 |
| Immigrants | Australia | 100.0 /100 | #4 | Exceptional $57,953 |
| Immigrants | Iran | 100.0 /100 | #5 | Exceptional $57,759 |
| Immigrants | Taiwan | 100.0 /100 | #6 | Exceptional $57,742 |
| Immigrants | Israel | 100.0 /100 | #7 | Exceptional $57,384 |
| Immigrants | Hong Kong | 100.0 /100 | #8 | Exceptional $56,709 |
| Immigrants | Ireland | 100.0 /100 | #9 | Exceptional $56,584 |
| Okinawans | 100.0 /100 | #10 | Exceptional $55,817 |
| Eastern Europeans | 100.0 /100 | #11 | Exceptional $55,780 |
| Immigrants | Sweden | 100.0 /100 | #12 | Exceptional $55,582 |
| Immigrants | India | 100.0 /100 | #13 | Exceptional $55,268 |
| Immigrants | Belgium | 100.0 /100 | #14 | Exceptional $55,082 |
| Cypriots | 100.0 /100 | #15 | Exceptional $54,899 |
Demographics Similar to Sierra Leoneans by Per Capita Income
In terms of per capita income, the demographic groups most similar to Sierra Leoneans are Finnish ($43,461, a difference of 0.13%), Immigrants from Costa Rica ($43,464, a difference of 0.14%), Tlingit-Haida ($43,516, a difference of 0.25%), Immigrants from South Eastern Asia ($43,539, a difference of 0.31%), and Welsh ($43,233, a difference of 0.40%).
| Demographics | Rating | Rank | Per Capita Income |
| French | 50.7 /100 | #173 | Average $43,685 |
| Colombians | 50.0 /100 | #174 | Average $43,661 |
| Celtics | 48.9 /100 | #175 | Average $43,621 |
| Immigrants | South Eastern Asia | 46.6 /100 | #176 | Average $43,539 |
| Tlingit-Haida | 45.9 /100 | #177 | Average $43,516 |
| Immigrants | Costa Rica | 44.5 /100 | #178 | Average $43,464 |
| Finns | 44.4 /100 | #179 | Average $43,461 |
| Sierra Leoneans | 42.9 /100 | #180 | Average $43,405 |
| Welsh | 38.2 /100 | #181 | Fair $43,233 |
| Immigrants | Vietnam | 38.1 /100 | #182 | Fair $43,229 |
| Germans | 33.9 /100 | #183 | Fair $43,067 |
| Spaniards | 32.9 /100 | #184 | Fair $43,028 |
| Immigrants | Immigrants | 32.5 /100 | #185 | Fair $43,010 |
| French Canadians | 32.3 /100 | #186 | Fair $43,003 |
| Immigrants | Colombia | 31.5 /100 | #187 | Fair $42,971 |