Subsaharan African vs Sierra Leonean Per Capita Income
COMPARE
Subsaharan African
Sierra Leonean
Per Capita Income
Per Capita Income Comparison
Sub-Saharan Africans
Sierra Leoneans
$40,152
PER CAPITA INCOME
1.9/ 100
METRIC RATING
245th/ 347
METRIC RANK
$43,405
PER CAPITA INCOME
42.9/ 100
METRIC RATING
180th/ 347
METRIC RANK
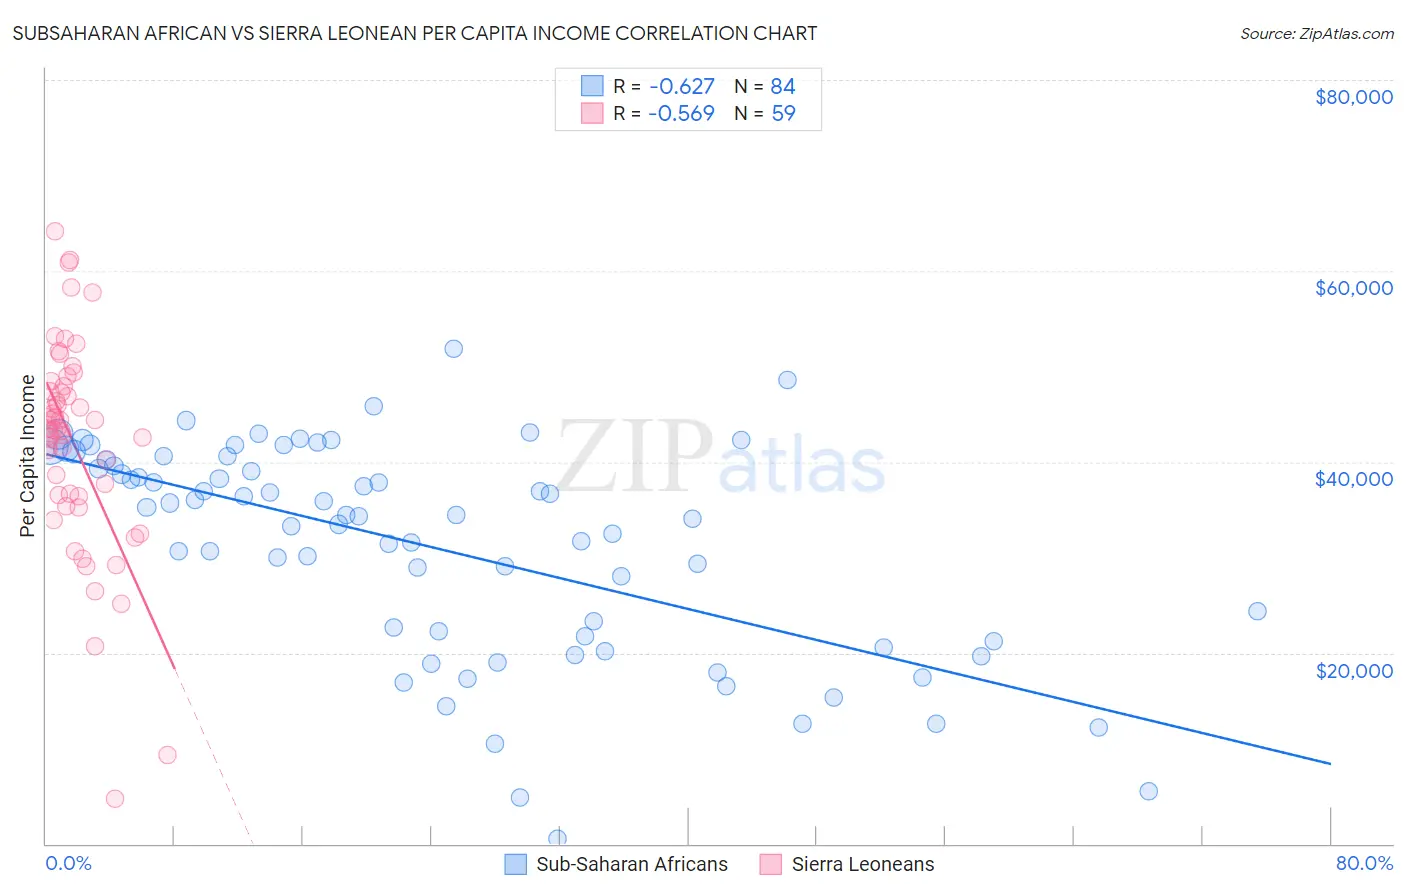
Subsaharan African vs Sierra Leonean Per Capita Income Correlation Chart
The statistical analysis conducted on geographies consisting of 508,279,002 people shows a significant negative correlation between the proportion of Sub-Saharan Africans and per capita income in the United States with a correlation coefficient (R) of -0.627 and weighted average of $40,152. Similarly, the statistical analysis conducted on geographies consisting of 83,350,653 people shows a substantial negative correlation between the proportion of Sierra Leoneans and per capita income in the United States with a correlation coefficient (R) of -0.569 and weighted average of $43,405, a difference of 8.1%.
Per Capita Income Correlation Summary
| Measurement | Subsaharan African | Sierra Leonean |
| Minimum | $461 | $4,657 |
| Maximum | $51,790 | $64,096 |
| Range | $51,329 | $59,439 |
| Mean | $31,049 | $41,867 |
| Median | $34,354 | $43,497 |
| Interquartile 25% (IQ1) | $21,454 | $36,386 |
| Interquartile 75% (IQ3) | $39,919 | $47,973 |
| Interquartile Range (IQR) | $18,464 | $11,587 |
| Standard Deviation (Sample) | $11,215 | $11,153 |
| Standard Deviation (Population) | $11,148 | $11,058 |
Similar Demographics by Per Capita Income
Demographics Similar to Sub-Saharan Africans by Per Capita Income
In terms of per capita income, the demographic groups most similar to Sub-Saharan Africans are French American Indian ($40,244, a difference of 0.23%), Cree ($40,056, a difference of 0.24%), German Russian ($40,266, a difference of 0.28%), Immigrants from Western Africa ($40,294, a difference of 0.35%), and British West Indian ($40,330, a difference of 0.44%).
| Demographics | Rating | Rank | Per Capita Income |
| Somalis | 2.4 /100 | #238 | Tragic $40,367 |
| Tsimshian | 2.4 /100 | #239 | Tragic $40,344 |
| Immigrants | Nigeria | 2.3 /100 | #240 | Tragic $40,339 |
| British West Indians | 2.3 /100 | #241 | Tragic $40,330 |
| Immigrants | Western Africa | 2.2 /100 | #242 | Tragic $40,294 |
| German Russians | 2.2 /100 | #243 | Tragic $40,266 |
| French American Indians | 2.1 /100 | #244 | Tragic $40,244 |
| Sub-Saharan Africans | 1.9 /100 | #245 | Tragic $40,152 |
| Cree | 1.7 /100 | #246 | Tragic $40,056 |
| Immigrants | Somalia | 1.6 /100 | #247 | Tragic $39,974 |
| Cape Verdeans | 1.5 /100 | #248 | Tragic $39,935 |
| Japanese | 1.4 /100 | #249 | Tragic $39,870 |
| Immigrants | Burma/Myanmar | 1.3 /100 | #250 | Tragic $39,827 |
| Samoans | 1.3 /100 | #251 | Tragic $39,826 |
| Immigrants | Azores | 1.0 /100 | #252 | Tragic $39,608 |
Demographics Similar to Sierra Leoneans by Per Capita Income
In terms of per capita income, the demographic groups most similar to Sierra Leoneans are Finnish ($43,461, a difference of 0.13%), Immigrants from Costa Rica ($43,464, a difference of 0.14%), Tlingit-Haida ($43,516, a difference of 0.25%), Immigrants from South Eastern Asia ($43,539, a difference of 0.31%), and Welsh ($43,233, a difference of 0.40%).
| Demographics | Rating | Rank | Per Capita Income |
| French | 50.7 /100 | #173 | Average $43,685 |
| Colombians | 50.0 /100 | #174 | Average $43,661 |
| Celtics | 48.9 /100 | #175 | Average $43,621 |
| Immigrants | South Eastern Asia | 46.6 /100 | #176 | Average $43,539 |
| Tlingit-Haida | 45.9 /100 | #177 | Average $43,516 |
| Immigrants | Costa Rica | 44.5 /100 | #178 | Average $43,464 |
| Finns | 44.4 /100 | #179 | Average $43,461 |
| Sierra Leoneans | 42.9 /100 | #180 | Average $43,405 |
| Welsh | 38.2 /100 | #181 | Fair $43,233 |
| Immigrants | Vietnam | 38.1 /100 | #182 | Fair $43,229 |
| Germans | 33.9 /100 | #183 | Fair $43,067 |
| Spaniards | 32.9 /100 | #184 | Fair $43,028 |
| Immigrants | Immigrants | 32.5 /100 | #185 | Fair $43,010 |
| French Canadians | 32.3 /100 | #186 | Fair $43,003 |
| Immigrants | Colombia | 31.5 /100 | #187 | Fair $42,971 |