Hmong vs Blackfeet Median Household Income
COMPARE
Hmong
Blackfeet
Median Household Income
Median Household Income Comparison
Hmong
Blackfeet
$75,839
MEDIAN HOUSEHOLD INCOME
0.3/ 100
METRIC RATING
270th/ 347
METRIC RANK
$73,509
MEDIAN HOUSEHOLD INCOME
0.1/ 100
METRIC RATING
294th/ 347
METRIC RANK
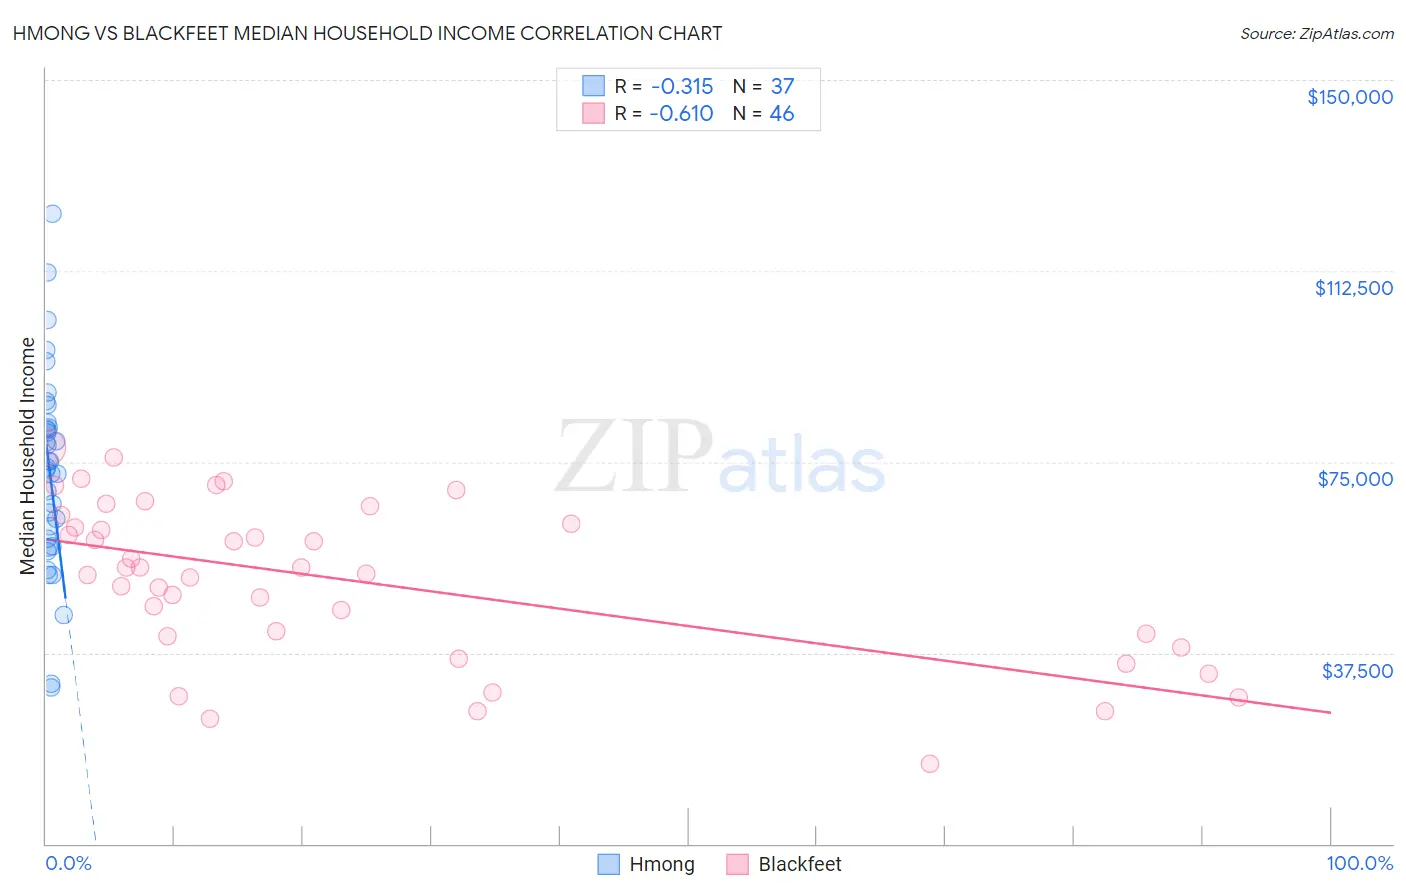
Hmong vs Blackfeet Median Household Income Correlation Chart
The statistical analysis conducted on geographies consisting of 24,655,529 people shows a mild negative correlation between the proportion of Hmong and median household income in the United States with a correlation coefficient (R) of -0.315 and weighted average of $75,839. Similarly, the statistical analysis conducted on geographies consisting of 309,432,508 people shows a significant negative correlation between the proportion of Blackfeet and median household income in the United States with a correlation coefficient (R) of -0.610 and weighted average of $73,509, a difference of 3.2%.
Median Household Income Correlation Summary
| Measurement | Hmong | Blackfeet |
| Minimum | $30,679 | $15,625 |
| Maximum | $123,750 | $77,855 |
| Range | $93,071 | $62,230 |
| Mean | $73,160 | $51,582 |
| Median | $73,828 | $53,641 |
| Interquartile 25% (IQ1) | $59,130 | $40,750 |
| Interquartile 75% (IQ3) | $82,249 | $62,870 |
| Interquartile Range (IQR) | $23,119 | $22,120 |
| Standard Deviation (Sample) | $19,589 | $15,583 |
| Standard Deviation (Population) | $19,322 | $15,413 |
Similar Demographics by Median Household Income
Demographics Similar to Hmong by Median Household Income
In terms of median household income, the demographic groups most similar to Hmong are Cape Verdean ($75,848, a difference of 0.010%), German Russian ($75,856, a difference of 0.020%), Immigrants from Jamaica ($75,851, a difference of 0.020%), Pennsylvania German ($75,814, a difference of 0.030%), and Somali ($75,782, a difference of 0.080%).
| Demographics | Rating | Rank | Median Household Income |
| Alaskan Athabascans | 0.4 /100 | #263 | Tragic $76,383 |
| Guatemalans | 0.3 /100 | #264 | Tragic $75,961 |
| Immigrants | Belize | 0.3 /100 | #265 | Tragic $75,938 |
| Americans | 0.3 /100 | #266 | Tragic $75,932 |
| German Russians | 0.3 /100 | #267 | Tragic $75,856 |
| Immigrants | Jamaica | 0.3 /100 | #268 | Tragic $75,851 |
| Cape Verdeans | 0.3 /100 | #269 | Tragic $75,848 |
| Hmong | 0.3 /100 | #270 | Tragic $75,839 |
| Pennsylvania Germans | 0.3 /100 | #271 | Tragic $75,814 |
| Somalis | 0.3 /100 | #272 | Tragic $75,782 |
| Liberians | 0.2 /100 | #273 | Tragic $75,667 |
| British West Indians | 0.2 /100 | #274 | Tragic $75,647 |
| Immigrants | Micronesia | 0.2 /100 | #275 | Tragic $75,574 |
| Immigrants | Latin America | 0.2 /100 | #276 | Tragic $75,420 |
| Spanish Americans | 0.2 /100 | #277 | Tragic $75,386 |
Demographics Similar to Blackfeet by Median Household Income
In terms of median household income, the demographic groups most similar to Blackfeet are Immigrants from Cabo Verde ($73,515, a difference of 0.010%), Cuban ($73,392, a difference of 0.16%), Haitian ($73,306, a difference of 0.28%), Comanche ($73,747, a difference of 0.32%), and Hispanic or Latino ($73,823, a difference of 0.43%).
| Demographics | Rating | Rank | Median Household Income |
| Iroquois | 0.1 /100 | #287 | Tragic $74,279 |
| Immigrants | Central America | 0.1 /100 | #288 | Tragic $74,217 |
| Fijians | 0.1 /100 | #289 | Tragic $74,205 |
| Bangladeshis | 0.1 /100 | #290 | Tragic $74,112 |
| Hispanics or Latinos | 0.1 /100 | #291 | Tragic $73,823 |
| Comanche | 0.1 /100 | #292 | Tragic $73,747 |
| Immigrants | Cabo Verde | 0.1 /100 | #293 | Tragic $73,515 |
| Blackfeet | 0.1 /100 | #294 | Tragic $73,509 |
| Cubans | 0.1 /100 | #295 | Tragic $73,392 |
| Haitians | 0.1 /100 | #296 | Tragic $73,306 |
| Immigrants | Mexico | 0.0 /100 | #297 | Tragic $73,160 |
| Paiute | 0.0 /100 | #298 | Tragic $72,959 |
| Indonesians | 0.0 /100 | #299 | Tragic $72,856 |
| Immigrants | Dominica | 0.0 /100 | #300 | Tragic $72,760 |
| Cherokee | 0.0 /100 | #301 | Tragic $72,682 |