Hmong vs Immigrants from Thailand Median Household Income
COMPARE
Hmong
Immigrants from Thailand
Median Household Income
Median Household Income Comparison
Hmong
Immigrants from Thailand
$75,839
MEDIAN HOUSEHOLD INCOME
0.3/ 100
METRIC RATING
270th/ 347
METRIC RANK
$83,327
MEDIAN HOUSEHOLD INCOME
24.3/ 100
METRIC RATING
202nd/ 347
METRIC RANK
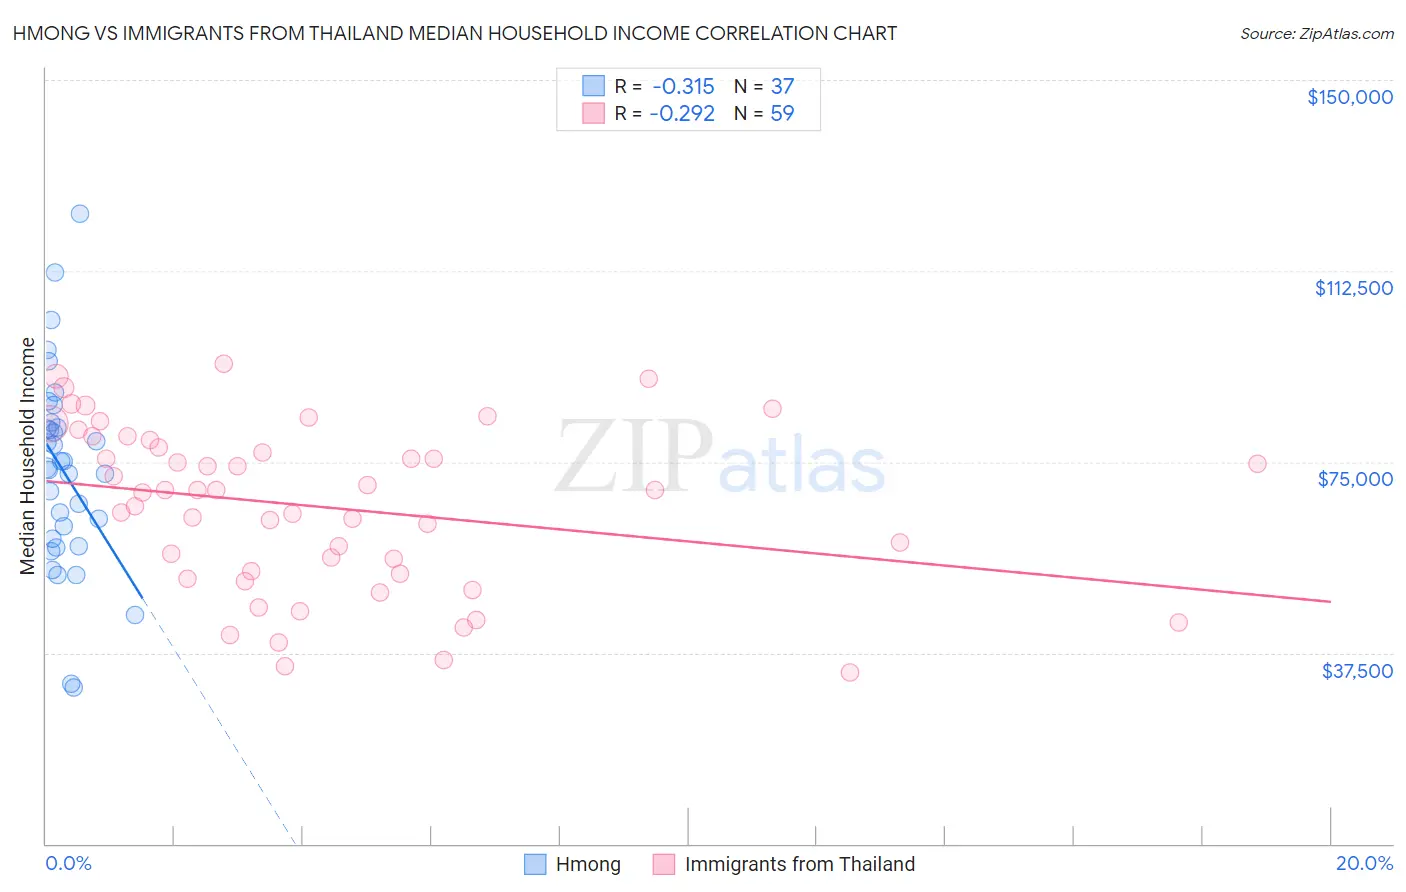
Hmong vs Immigrants from Thailand Median Household Income Correlation Chart
The statistical analysis conducted on geographies consisting of 24,655,529 people shows a mild negative correlation between the proportion of Hmong and median household income in the United States with a correlation coefficient (R) of -0.315 and weighted average of $75,839. Similarly, the statistical analysis conducted on geographies consisting of 316,905,677 people shows a weak negative correlation between the proportion of Immigrants from Thailand and median household income in the United States with a correlation coefficient (R) of -0.292 and weighted average of $83,327, a difference of 9.9%.
Median Household Income Correlation Summary
| Measurement | Hmong | Immigrants from Thailand |
| Minimum | $30,679 | $33,750 |
| Maximum | $123,750 | $94,169 |
| Range | $93,071 | $60,419 |
| Mean | $73,160 | $66,115 |
| Median | $73,828 | $69,375 |
| Interquartile 25% (IQ1) | $59,130 | $53,069 |
| Interquartile 75% (IQ3) | $82,249 | $79,311 |
| Interquartile Range (IQR) | $23,119 | $26,242 |
| Standard Deviation (Sample) | $19,589 | $16,097 |
| Standard Deviation (Population) | $19,322 | $15,960 |
Similar Demographics by Median Household Income
Demographics Similar to Hmong by Median Household Income
In terms of median household income, the demographic groups most similar to Hmong are Cape Verdean ($75,848, a difference of 0.010%), German Russian ($75,856, a difference of 0.020%), Immigrants from Jamaica ($75,851, a difference of 0.020%), Pennsylvania German ($75,814, a difference of 0.030%), and Somali ($75,782, a difference of 0.080%).
| Demographics | Rating | Rank | Median Household Income |
| Alaskan Athabascans | 0.4 /100 | #263 | Tragic $76,383 |
| Guatemalans | 0.3 /100 | #264 | Tragic $75,961 |
| Immigrants | Belize | 0.3 /100 | #265 | Tragic $75,938 |
| Americans | 0.3 /100 | #266 | Tragic $75,932 |
| German Russians | 0.3 /100 | #267 | Tragic $75,856 |
| Immigrants | Jamaica | 0.3 /100 | #268 | Tragic $75,851 |
| Cape Verdeans | 0.3 /100 | #269 | Tragic $75,848 |
| Hmong | 0.3 /100 | #270 | Tragic $75,839 |
| Pennsylvania Germans | 0.3 /100 | #271 | Tragic $75,814 |
| Somalis | 0.3 /100 | #272 | Tragic $75,782 |
| Liberians | 0.2 /100 | #273 | Tragic $75,667 |
| British West Indians | 0.2 /100 | #274 | Tragic $75,647 |
| Immigrants | Micronesia | 0.2 /100 | #275 | Tragic $75,574 |
| Immigrants | Latin America | 0.2 /100 | #276 | Tragic $75,420 |
| Spanish Americans | 0.2 /100 | #277 | Tragic $75,386 |
Demographics Similar to Immigrants from Thailand by Median Household Income
In terms of median household income, the demographic groups most similar to Immigrants from Thailand are Tsimshian ($83,346, a difference of 0.020%), Spanish ($83,343, a difference of 0.020%), Immigrants from Cambodia ($83,304, a difference of 0.030%), German ($83,358, a difference of 0.040%), and Immigrants from Africa ($83,289, a difference of 0.050%).
| Demographics | Rating | Rank | Median Household Income |
| Immigrants | Armenia | 27.0 /100 | #195 | Fair $83,555 |
| French | 26.0 /100 | #196 | Fair $83,468 |
| Aleuts | 25.7 /100 | #197 | Fair $83,446 |
| Japanese | 25.1 /100 | #198 | Fair $83,395 |
| Germans | 24.6 /100 | #199 | Fair $83,358 |
| Tsimshian | 24.5 /100 | #200 | Fair $83,346 |
| Spanish | 24.4 /100 | #201 | Fair $83,343 |
| Immigrants | Thailand | 24.3 /100 | #202 | Fair $83,327 |
| Immigrants | Cambodia | 24.0 /100 | #203 | Fair $83,304 |
| Immigrants | Africa | 23.8 /100 | #204 | Fair $83,289 |
| Celtics | 22.7 /100 | #205 | Fair $83,193 |
| Immigrants | Kenya | 21.3 /100 | #206 | Fair $83,068 |
| Dutch | 20.3 /100 | #207 | Fair $82,971 |
| French Canadians | 18.7 /100 | #208 | Poor $82,810 |
| Immigrants | Iraq | 16.7 /100 | #209 | Poor $82,594 |