Hmong vs Pima Median Household Income
COMPARE
Hmong
Pima
Median Household Income
Median Household Income Comparison
Hmong
Pima
$75,839
MEDIAN HOUSEHOLD INCOME
0.3/ 100
METRIC RATING
270th/ 347
METRIC RANK
$63,262
MEDIAN HOUSEHOLD INCOME
0.0/ 100
METRIC RATING
342nd/ 347
METRIC RANK
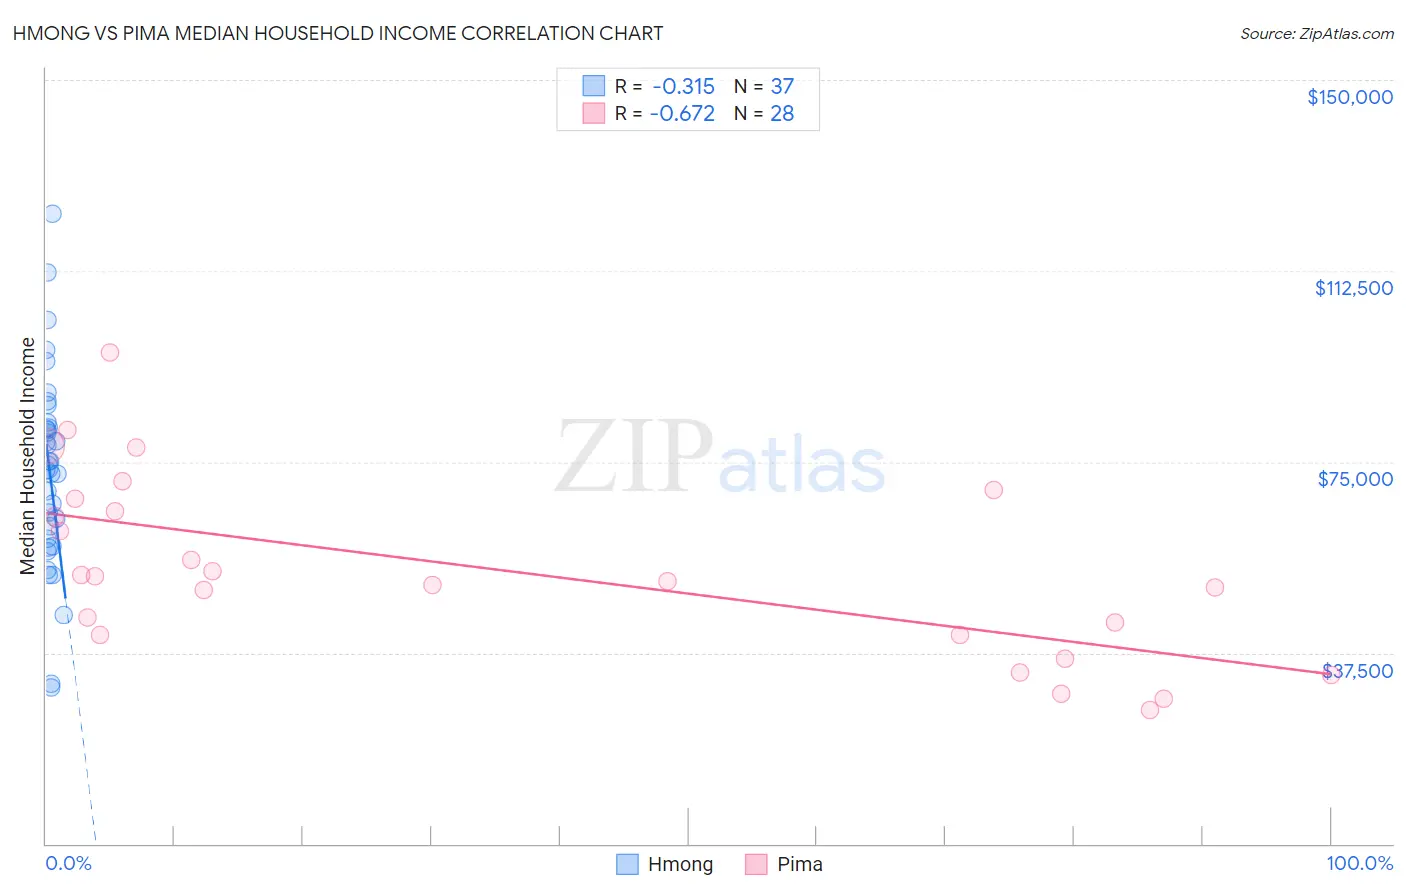
Hmong vs Pima Median Household Income Correlation Chart
The statistical analysis conducted on geographies consisting of 24,655,529 people shows a mild negative correlation between the proportion of Hmong and median household income in the United States with a correlation coefficient (R) of -0.315 and weighted average of $75,839. Similarly, the statistical analysis conducted on geographies consisting of 61,537,269 people shows a significant negative correlation between the proportion of Pima and median household income in the United States with a correlation coefficient (R) of -0.672 and weighted average of $63,262, a difference of 19.9%.
Median Household Income Correlation Summary
| Measurement | Hmong | Pima |
| Minimum | $30,679 | $26,339 |
| Maximum | $123,750 | $96,415 |
| Range | $93,071 | $70,076 |
| Mean | $73,160 | $53,826 |
| Median | $73,828 | $52,032 |
| Interquartile 25% (IQ1) | $59,130 | $40,965 |
| Interquartile 75% (IQ3) | $82,249 | $66,485 |
| Interquartile Range (IQR) | $23,119 | $25,519 |
| Standard Deviation (Sample) | $19,589 | $17,724 |
| Standard Deviation (Population) | $19,322 | $17,405 |
Similar Demographics by Median Household Income
Demographics Similar to Hmong by Median Household Income
In terms of median household income, the demographic groups most similar to Hmong are Cape Verdean ($75,848, a difference of 0.010%), German Russian ($75,856, a difference of 0.020%), Immigrants from Jamaica ($75,851, a difference of 0.020%), Pennsylvania German ($75,814, a difference of 0.030%), and Somali ($75,782, a difference of 0.080%).
| Demographics | Rating | Rank | Median Household Income |
| Alaskan Athabascans | 0.4 /100 | #263 | Tragic $76,383 |
| Guatemalans | 0.3 /100 | #264 | Tragic $75,961 |
| Immigrants | Belize | 0.3 /100 | #265 | Tragic $75,938 |
| Americans | 0.3 /100 | #266 | Tragic $75,932 |
| German Russians | 0.3 /100 | #267 | Tragic $75,856 |
| Immigrants | Jamaica | 0.3 /100 | #268 | Tragic $75,851 |
| Cape Verdeans | 0.3 /100 | #269 | Tragic $75,848 |
| Hmong | 0.3 /100 | #270 | Tragic $75,839 |
| Pennsylvania Germans | 0.3 /100 | #271 | Tragic $75,814 |
| Somalis | 0.3 /100 | #272 | Tragic $75,782 |
| Liberians | 0.2 /100 | #273 | Tragic $75,667 |
| British West Indians | 0.2 /100 | #274 | Tragic $75,647 |
| Immigrants | Micronesia | 0.2 /100 | #275 | Tragic $75,574 |
| Immigrants | Latin America | 0.2 /100 | #276 | Tragic $75,420 |
| Spanish Americans | 0.2 /100 | #277 | Tragic $75,386 |
Demographics Similar to Pima by Median Household Income
In terms of median household income, the demographic groups most similar to Pima are Crow ($63,681, a difference of 0.66%), Houma ($62,575, a difference of 1.1%), Pueblo ($64,692, a difference of 2.3%), Tohono O'odham ($61,663, a difference of 2.6%), and Hopi ($65,043, a difference of 2.8%).
| Demographics | Rating | Rank | Median Household Income |
| Creek | 0.0 /100 | #333 | Tragic $67,715 |
| Blacks/African Americans | 0.0 /100 | #334 | Tragic $67,573 |
| Cheyenne | 0.0 /100 | #335 | Tragic $66,974 |
| Immigrants | Congo | 0.0 /100 | #336 | Tragic $66,768 |
| Kiowa | 0.0 /100 | #337 | Tragic $65,914 |
| Immigrants | Yemen | 0.0 /100 | #338 | Tragic $65,194 |
| Hopi | 0.0 /100 | #339 | Tragic $65,043 |
| Pueblo | 0.0 /100 | #340 | Tragic $64,692 |
| Crow | 0.0 /100 | #341 | Tragic $63,681 |
| Pima | 0.0 /100 | #342 | Tragic $63,262 |
| Houma | 0.0 /100 | #343 | Tragic $62,575 |
| Tohono O'odham | 0.0 /100 | #344 | Tragic $61,663 |
| Puerto Ricans | 0.0 /100 | #345 | Tragic $59,197 |
| Navajo | 0.0 /100 | #346 | Tragic $59,159 |
| Lumbee | 0.0 /100 | #347 | Tragic $54,644 |