Hmong vs Immigrants from Albania Median Household Income
COMPARE
Hmong
Immigrants from Albania
Median Household Income
Median Household Income Comparison
Hmong
Immigrants from Albania
$75,839
MEDIAN HOUSEHOLD INCOME
0.3/ 100
METRIC RATING
270th/ 347
METRIC RANK
$86,534
MEDIAN HOUSEHOLD INCOME
71.5/ 100
METRIC RATING
156th/ 347
METRIC RANK
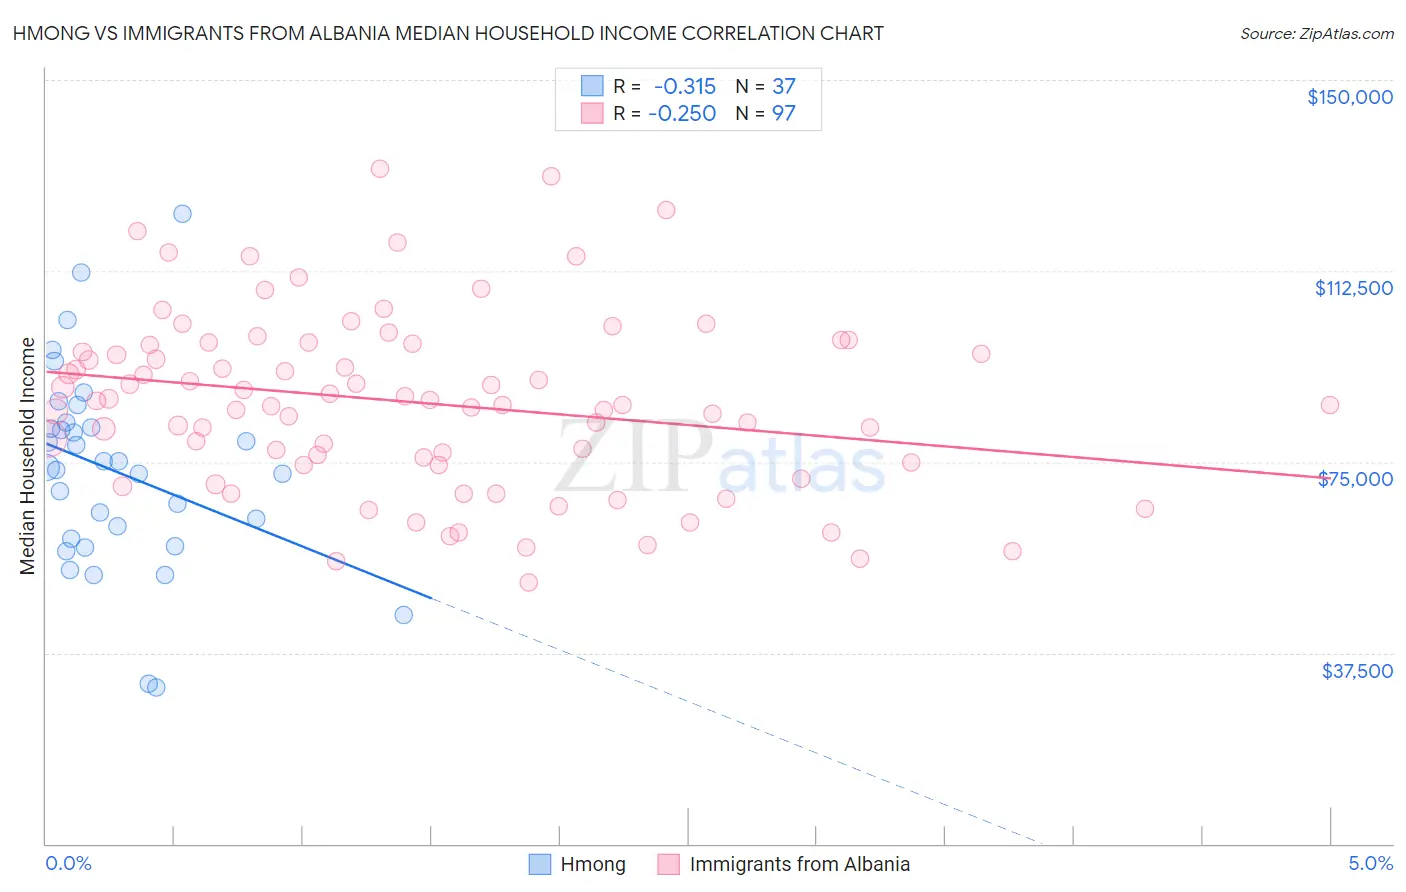
Hmong vs Immigrants from Albania Median Household Income Correlation Chart
The statistical analysis conducted on geographies consisting of 24,655,529 people shows a mild negative correlation between the proportion of Hmong and median household income in the United States with a correlation coefficient (R) of -0.315 and weighted average of $75,839. Similarly, the statistical analysis conducted on geographies consisting of 119,343,332 people shows a weak negative correlation between the proportion of Immigrants from Albania and median household income in the United States with a correlation coefficient (R) of -0.250 and weighted average of $86,534, a difference of 14.1%.
Median Household Income Correlation Summary
| Measurement | Hmong | Immigrants from Albania |
| Minimum | $30,679 | $51,316 |
| Maximum | $123,750 | $132,457 |
| Range | $93,071 | $81,141 |
| Mean | $73,160 | $86,652 |
| Median | $73,828 | $86,175 |
| Interquartile 25% (IQ1) | $59,130 | $74,686 |
| Interquartile 75% (IQ3) | $82,249 | $98,070 |
| Interquartile Range (IQR) | $23,119 | $23,384 |
| Standard Deviation (Sample) | $19,589 | $17,379 |
| Standard Deviation (Population) | $19,322 | $17,290 |
Similar Demographics by Median Household Income
Demographics Similar to Hmong by Median Household Income
In terms of median household income, the demographic groups most similar to Hmong are Cape Verdean ($75,848, a difference of 0.010%), German Russian ($75,856, a difference of 0.020%), Immigrants from Jamaica ($75,851, a difference of 0.020%), Pennsylvania German ($75,814, a difference of 0.030%), and Somali ($75,782, a difference of 0.080%).
| Demographics | Rating | Rank | Median Household Income |
| Alaskan Athabascans | 0.4 /100 | #263 | Tragic $76,383 |
| Guatemalans | 0.3 /100 | #264 | Tragic $75,961 |
| Immigrants | Belize | 0.3 /100 | #265 | Tragic $75,938 |
| Americans | 0.3 /100 | #266 | Tragic $75,932 |
| German Russians | 0.3 /100 | #267 | Tragic $75,856 |
| Immigrants | Jamaica | 0.3 /100 | #268 | Tragic $75,851 |
| Cape Verdeans | 0.3 /100 | #269 | Tragic $75,848 |
| Hmong | 0.3 /100 | #270 | Tragic $75,839 |
| Pennsylvania Germans | 0.3 /100 | #271 | Tragic $75,814 |
| Somalis | 0.3 /100 | #272 | Tragic $75,782 |
| Liberians | 0.2 /100 | #273 | Tragic $75,667 |
| British West Indians | 0.2 /100 | #274 | Tragic $75,647 |
| Immigrants | Micronesia | 0.2 /100 | #275 | Tragic $75,574 |
| Immigrants | Latin America | 0.2 /100 | #276 | Tragic $75,420 |
| Spanish Americans | 0.2 /100 | #277 | Tragic $75,386 |
Demographics Similar to Immigrants from Albania by Median Household Income
In terms of median household income, the demographic groups most similar to Immigrants from Albania are Samoan ($86,498, a difference of 0.040%), Moroccan ($86,468, a difference of 0.080%), Carpatho Rusyn ($86,635, a difference of 0.12%), Immigrants from Uzbekistan ($86,425, a difference of 0.13%), and Luxembourger ($86,418, a difference of 0.13%).
| Demographics | Rating | Rank | Median Household Income |
| Immigrants | Nepal | 77.7 /100 | #149 | Good $87,046 |
| Basques | 77.2 /100 | #150 | Good $87,001 |
| Hungarians | 76.3 /100 | #151 | Good $86,920 |
| Immigrants | Saudi Arabia | 75.8 /100 | #152 | Good $86,875 |
| South Americans | 75.1 /100 | #153 | Good $86,824 |
| Immigrants | Germany | 74.4 /100 | #154 | Good $86,764 |
| Carpatho Rusyns | 72.8 /100 | #155 | Good $86,635 |
| Immigrants | Albania | 71.5 /100 | #156 | Good $86,534 |
| Samoans | 71.0 /100 | #157 | Good $86,498 |
| Moroccans | 70.6 /100 | #158 | Good $86,468 |
| Immigrants | Uzbekistan | 70.1 /100 | #159 | Good $86,425 |
| Luxembourgers | 70.0 /100 | #160 | Good $86,418 |
| Slavs | 69.7 /100 | #161 | Good $86,398 |
| Guamanians/Chamorros | 67.7 /100 | #162 | Good $86,255 |
| Czechs | 66.4 /100 | #163 | Good $86,164 |