Hawaiian vs Immigrants from El Salvador Median Earnings
COMPARE
Hawaiian
Immigrants from El Salvador
Median Earnings
Median Earnings Comparison
Hawaiians
Immigrants from El Salvador
$43,673
MEDIAN EARNINGS
2.0/ 100
METRIC RATING
252nd/ 347
METRIC RANK
$42,413
MEDIAN EARNINGS
0.4/ 100
METRIC RATING
274th/ 347
METRIC RANK
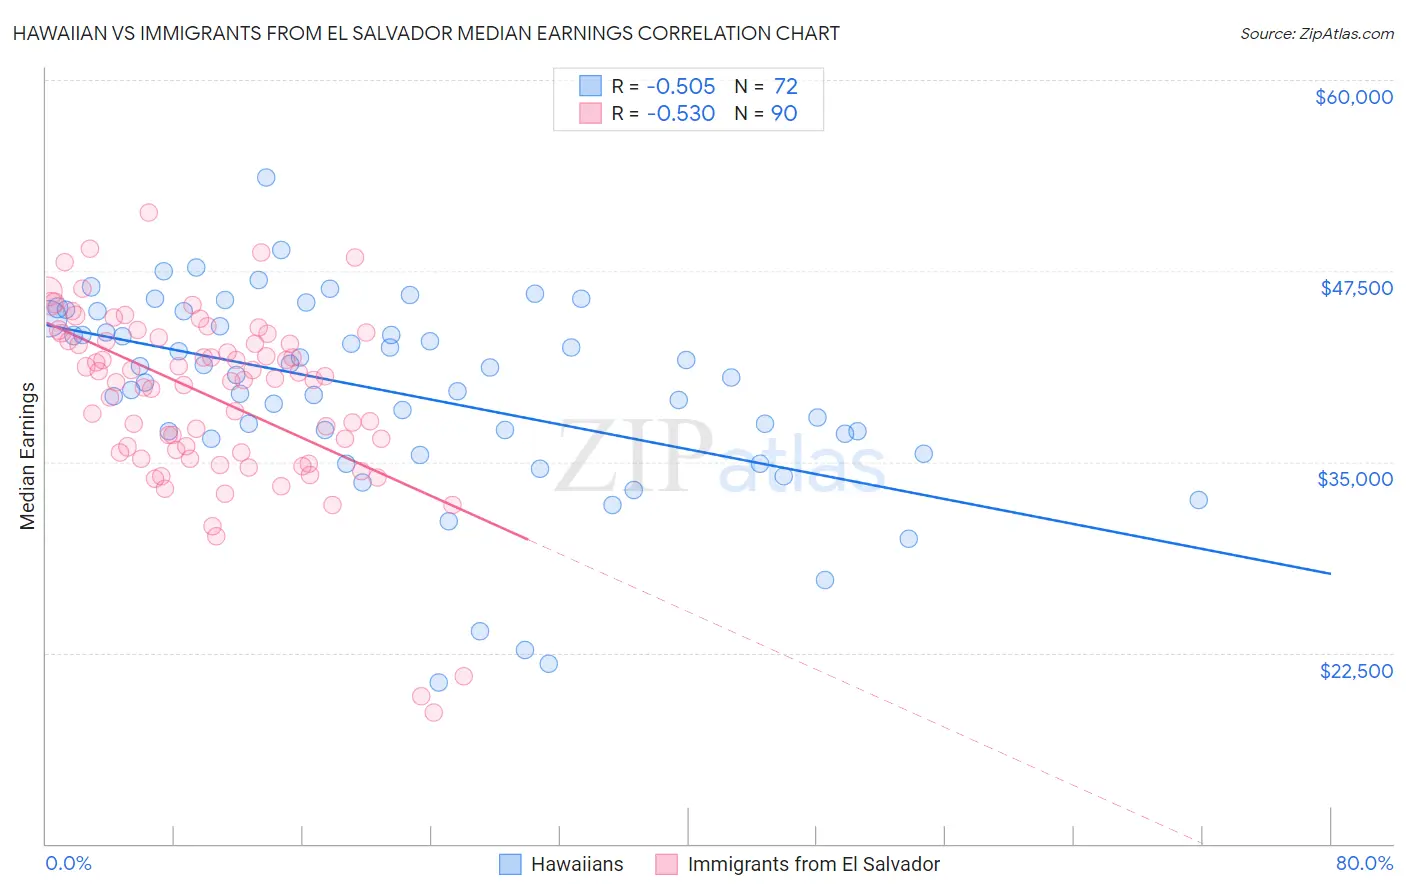
Hawaiian vs Immigrants from El Salvador Median Earnings Correlation Chart
The statistical analysis conducted on geographies consisting of 327,597,222 people shows a substantial negative correlation between the proportion of Hawaiians and median earnings in the United States with a correlation coefficient (R) of -0.505 and weighted average of $43,673. Similarly, the statistical analysis conducted on geographies consisting of 357,819,610 people shows a substantial negative correlation between the proportion of Immigrants from El Salvador and median earnings in the United States with a correlation coefficient (R) of -0.530 and weighted average of $42,413, a difference of 3.0%.
Median Earnings Correlation Summary
| Measurement | Hawaiian | Immigrants from El Salvador |
| Minimum | $20,530 | $18,605 |
| Maximum | $53,613 | $51,289 |
| Range | $33,083 | $32,684 |
| Mean | $39,525 | $39,285 |
| Median | $40,637 | $40,413 |
| Interquartile 25% (IQ1) | $36,694 | $35,635 |
| Interquartile 75% (IQ3) | $44,126 | $43,130 |
| Interquartile Range (IQR) | $7,432 | $7,494 |
| Standard Deviation (Sample) | $6,473 | $5,807 |
| Standard Deviation (Population) | $6,428 | $5,775 |
Similar Demographics by Median Earnings
Demographics Similar to Hawaiians by Median Earnings
In terms of median earnings, the demographic groups most similar to Hawaiians are Tsimshian ($43,695, a difference of 0.050%), Alaska Native ($43,750, a difference of 0.18%), Somali ($43,567, a difference of 0.24%), Liberian ($43,536, a difference of 0.31%), and Malaysian ($43,844, a difference of 0.39%).
| Demographics | Rating | Rank | Median Earnings |
| Immigrants | Burma/Myanmar | 3.2 /100 | #245 | Tragic $43,998 |
| Immigrants | West Indies | 3.1 /100 | #246 | Tragic $43,989 |
| Immigrants | Cabo Verde | 3.0 /100 | #247 | Tragic $43,963 |
| Nepalese | 2.6 /100 | #248 | Tragic $43,860 |
| Malaysians | 2.6 /100 | #249 | Tragic $43,844 |
| Alaska Natives | 2.3 /100 | #250 | Tragic $43,750 |
| Tsimshian | 2.1 /100 | #251 | Tragic $43,695 |
| Hawaiians | 2.0 /100 | #252 | Tragic $43,673 |
| Somalis | 1.8 /100 | #253 | Tragic $43,567 |
| Liberians | 1.7 /100 | #254 | Tragic $43,536 |
| Immigrants | Middle Africa | 1.4 /100 | #255 | Tragic $43,416 |
| Alaskan Athabascans | 1.4 /100 | #256 | Tragic $43,393 |
| Jamaicans | 1.3 /100 | #257 | Tragic $43,343 |
| French American Indians | 1.3 /100 | #258 | Tragic $43,333 |
| German Russians | 1.1 /100 | #259 | Tragic $43,200 |
Demographics Similar to Immigrants from El Salvador by Median Earnings
In terms of median earnings, the demographic groups most similar to Immigrants from El Salvador are Immigrants from Dominica ($42,420, a difference of 0.020%), Iroquois ($42,430, a difference of 0.040%), Immigrants from Belize ($42,339, a difference of 0.18%), Spanish American ($42,316, a difference of 0.23%), and Central American ($42,280, a difference of 0.32%).
| Demographics | Rating | Rank | Median Earnings |
| Cree | 0.6 /100 | #267 | Tragic $42,777 |
| Americans | 0.6 /100 | #268 | Tragic $42,742 |
| Belizeans | 0.5 /100 | #269 | Tragic $42,702 |
| Osage | 0.5 /100 | #270 | Tragic $42,651 |
| Pennsylvania Germans | 0.5 /100 | #271 | Tragic $42,615 |
| Iroquois | 0.4 /100 | #272 | Tragic $42,430 |
| Immigrants | Dominica | 0.4 /100 | #273 | Tragic $42,420 |
| Immigrants | El Salvador | 0.4 /100 | #274 | Tragic $42,413 |
| Immigrants | Belize | 0.3 /100 | #275 | Tragic $42,339 |
| Spanish Americans | 0.3 /100 | #276 | Tragic $42,316 |
| Central Americans | 0.3 /100 | #277 | Tragic $42,280 |
| Cajuns | 0.3 /100 | #278 | Tragic $42,189 |
| Colville | 0.2 /100 | #279 | Tragic $42,151 |
| Hmong | 0.2 /100 | #280 | Tragic $42,111 |
| Marshallese | 0.2 /100 | #281 | Tragic $41,969 |