Hawaiian vs Burmese Median Family Income
COMPARE
Hawaiian
Burmese
Median Family Income
Median Family Income Comparison
Hawaiians
Burmese
$98,869
MEDIAN FAMILY INCOME
12.5/ 100
METRIC RATING
205th/ 347
METRIC RANK
$123,369
MEDIAN FAMILY INCOME
100.0/ 100
METRIC RATING
20th/ 347
METRIC RANK
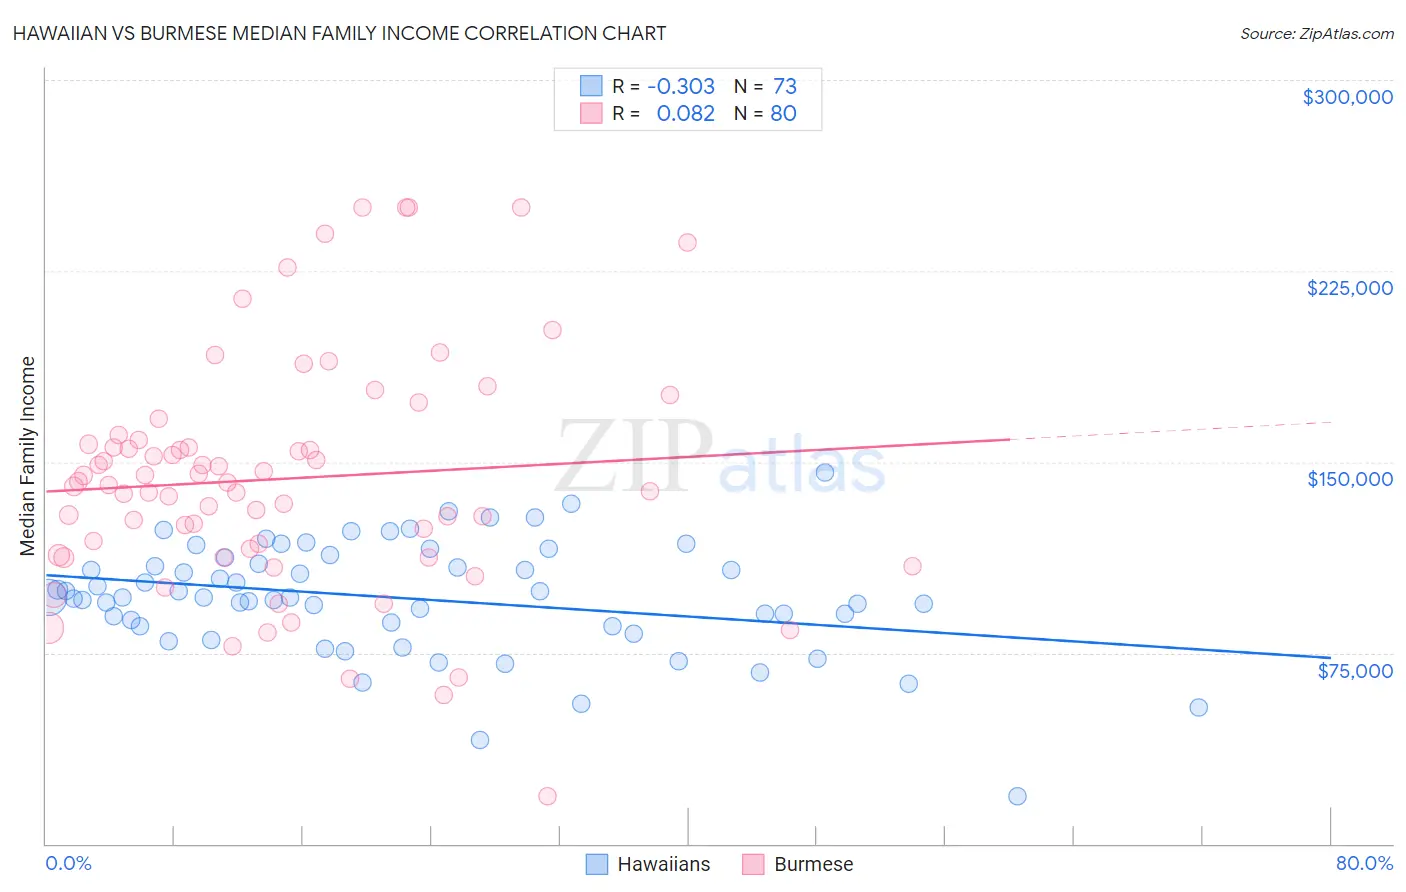
Hawaiian vs Burmese Median Family Income Correlation Chart
The statistical analysis conducted on geographies consisting of 327,312,132 people shows a mild negative correlation between the proportion of Hawaiians and median family income in the United States with a correlation coefficient (R) of -0.303 and weighted average of $98,869. Similarly, the statistical analysis conducted on geographies consisting of 464,661,736 people shows a slight positive correlation between the proportion of Burmese and median family income in the United States with a correlation coefficient (R) of 0.082 and weighted average of $123,369, a difference of 24.8%.
Median Family Income Correlation Summary
| Measurement | Hawaiian | Burmese |
| Minimum | $18,796 | $18,796 |
| Maximum | $146,000 | $250,001 |
| Range | $127,204 | $231,205 |
| Mean | $96,414 | $143,360 |
| Median | $96,571 | $141,361 |
| Interquartile 25% (IQ1) | $85,564 | $114,595 |
| Interquartile 75% (IQ3) | $111,384 | $157,872 |
| Interquartile Range (IQR) | $25,820 | $43,276 |
| Standard Deviation (Sample) | $22,234 | $46,200 |
| Standard Deviation (Population) | $22,081 | $45,911 |
Similar Demographics by Median Family Income
Demographics Similar to Hawaiians by Median Family Income
In terms of median family income, the demographic groups most similar to Hawaiians are Ghanaian ($98,877, a difference of 0.010%), Immigrants from Iraq ($98,786, a difference of 0.080%), Aleut ($98,702, a difference of 0.17%), Immigrants from Uruguay ($98,205, a difference of 0.68%), and Scotch-Irish ($99,591, a difference of 0.73%).
| Demographics | Rating | Rank | Median Family Income |
| Immigrants | Africa | 22.5 /100 | #198 | Fair $100,256 |
| Yugoslavians | 21.3 /100 | #199 | Fair $100,119 |
| Spanish | 20.1 /100 | #200 | Fair $99,977 |
| Immigrants | Thailand | 19.0 /100 | #201 | Poor $99,840 |
| Whites/Caucasians | 18.7 /100 | #202 | Poor $99,800 |
| Scotch-Irish | 17.1 /100 | #203 | Poor $99,591 |
| Ghanaians | 12.6 /100 | #204 | Poor $98,877 |
| Hawaiians | 12.5 /100 | #205 | Poor $98,869 |
| Immigrants | Iraq | 12.1 /100 | #206 | Poor $98,786 |
| Aleuts | 11.6 /100 | #207 | Poor $98,702 |
| Immigrants | Uruguay | 9.2 /100 | #208 | Tragic $98,205 |
| Immigrants | Colombia | 8.7 /100 | #209 | Tragic $98,067 |
| Puget Sound Salish | 8.2 /100 | #210 | Tragic $97,958 |
| Immigrants | Sudan | 7.4 /100 | #211 | Tragic $97,737 |
| Panamanians | 7.2 /100 | #212 | Tragic $97,683 |
Demographics Similar to Burmese by Median Family Income
In terms of median family income, the demographic groups most similar to Burmese are Immigrants from Belgium ($123,831, a difference of 0.37%), Immigrants from Korea ($122,800, a difference of 0.46%), Immigrants from Sweden ($122,765, a difference of 0.49%), Immigrants from Japan ($122,764, a difference of 0.49%), and Immigrants from Northern Europe ($121,840, a difference of 1.3%).
| Demographics | Rating | Rank | Median Family Income |
| Immigrants | Australia | 100.0 /100 | #13 | Exceptional $126,620 |
| Immigrants | South Central Asia | 100.0 /100 | #14 | Exceptional $125,956 |
| Eastern Europeans | 100.0 /100 | #15 | Exceptional $125,546 |
| Immigrants | China | 100.0 /100 | #16 | Exceptional $125,540 |
| Indians (Asian) | 100.0 /100 | #17 | Exceptional $125,312 |
| Immigrants | Eastern Asia | 100.0 /100 | #18 | Exceptional $125,150 |
| Immigrants | Belgium | 100.0 /100 | #19 | Exceptional $123,831 |
| Burmese | 100.0 /100 | #20 | Exceptional $123,369 |
| Immigrants | Korea | 100.0 /100 | #21 | Exceptional $122,800 |
| Immigrants | Sweden | 100.0 /100 | #22 | Exceptional $122,765 |
| Immigrants | Japan | 100.0 /100 | #23 | Exceptional $122,764 |
| Immigrants | Northern Europe | 100.0 /100 | #24 | Exceptional $121,840 |
| Turks | 100.0 /100 | #25 | Exceptional $121,202 |
| Immigrants | Switzerland | 100.0 /100 | #26 | Exceptional $120,726 |
| Russians | 100.0 /100 | #27 | Exceptional $120,487 |