Hawaiian vs Pakistani Median Family Income
COMPARE
Hawaiian
Pakistani
Median Family Income
Median Family Income Comparison
Hawaiians
Pakistanis
$98,869
MEDIAN FAMILY INCOME
12.5/ 100
METRIC RATING
205th/ 347
METRIC RANK
$107,390
MEDIAN FAMILY INCOME
91.7/ 100
METRIC RATING
124th/ 347
METRIC RANK
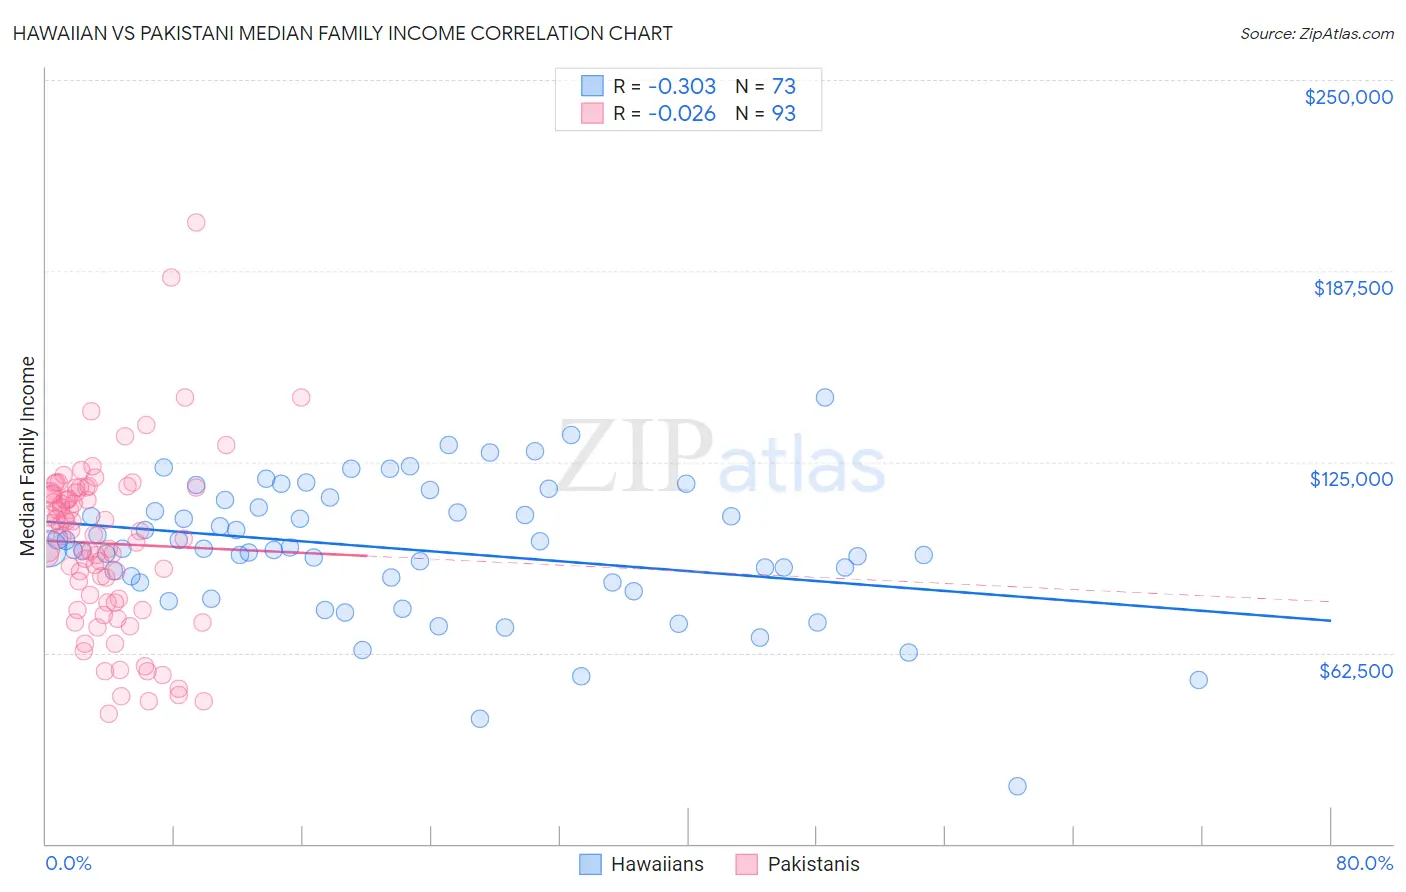
Hawaiian vs Pakistani Median Family Income Correlation Chart
The statistical analysis conducted on geographies consisting of 327,312,132 people shows a mild negative correlation between the proportion of Hawaiians and median family income in the United States with a correlation coefficient (R) of -0.303 and weighted average of $98,869. Similarly, the statistical analysis conducted on geographies consisting of 335,122,769 people shows no correlation between the proportion of Pakistanis and median family income in the United States with a correlation coefficient (R) of -0.026 and weighted average of $107,390, a difference of 8.6%.
Median Family Income Correlation Summary
| Measurement | Hawaiian | Pakistani |
| Minimum | $18,796 | $42,414 |
| Maximum | $146,000 | $203,281 |
| Range | $127,204 | $160,867 |
| Mean | $96,414 | $98,287 |
| Median | $96,571 | $101,250 |
| Interquartile 25% (IQ1) | $85,564 | $78,908 |
| Interquartile 75% (IQ3) | $111,384 | $114,990 |
| Interquartile Range (IQR) | $25,820 | $36,082 |
| Standard Deviation (Sample) | $22,234 | $28,141 |
| Standard Deviation (Population) | $22,081 | $27,989 |
Similar Demographics by Median Family Income
Demographics Similar to Hawaiians by Median Family Income
In terms of median family income, the demographic groups most similar to Hawaiians are Ghanaian ($98,877, a difference of 0.010%), Immigrants from Iraq ($98,786, a difference of 0.080%), Aleut ($98,702, a difference of 0.17%), Immigrants from Uruguay ($98,205, a difference of 0.68%), and Scotch-Irish ($99,591, a difference of 0.73%).
| Demographics | Rating | Rank | Median Family Income |
| Immigrants | Africa | 22.5 /100 | #198 | Fair $100,256 |
| Yugoslavians | 21.3 /100 | #199 | Fair $100,119 |
| Spanish | 20.1 /100 | #200 | Fair $99,977 |
| Immigrants | Thailand | 19.0 /100 | #201 | Poor $99,840 |
| Whites/Caucasians | 18.7 /100 | #202 | Poor $99,800 |
| Scotch-Irish | 17.1 /100 | #203 | Poor $99,591 |
| Ghanaians | 12.6 /100 | #204 | Poor $98,877 |
| Hawaiians | 12.5 /100 | #205 | Poor $98,869 |
| Immigrants | Iraq | 12.1 /100 | #206 | Poor $98,786 |
| Aleuts | 11.6 /100 | #207 | Poor $98,702 |
| Immigrants | Uruguay | 9.2 /100 | #208 | Tragic $98,205 |
| Immigrants | Colombia | 8.7 /100 | #209 | Tragic $98,067 |
| Puget Sound Salish | 8.2 /100 | #210 | Tragic $97,958 |
| Immigrants | Sudan | 7.4 /100 | #211 | Tragic $97,737 |
| Panamanians | 7.2 /100 | #212 | Tragic $97,683 |
Demographics Similar to Pakistanis by Median Family Income
In terms of median family income, the demographic groups most similar to Pakistanis are Taiwanese ($107,295, a difference of 0.090%), Carpatho Rusyn ($107,502, a difference of 0.11%), Serbian ($107,157, a difference of 0.22%), Lebanese ($107,086, a difference of 0.28%), and Immigrants from Jordan ($107,715, a difference of 0.30%).
| Demographics | Rating | Rank | Median Family Income |
| Immigrants | Philippines | 94.6 /100 | #117 | Exceptional $108,288 |
| Ethiopians | 94.5 /100 | #118 | Exceptional $108,251 |
| Sri Lankans | 94.5 /100 | #119 | Exceptional $108,234 |
| Immigrants | Northern Africa | 94.3 /100 | #120 | Exceptional $108,161 |
| Europeans | 94.1 /100 | #121 | Exceptional $108,099 |
| Immigrants | Jordan | 92.9 /100 | #122 | Exceptional $107,715 |
| Carpatho Rusyns | 92.2 /100 | #123 | Exceptional $107,502 |
| Pakistanis | 91.7 /100 | #124 | Exceptional $107,390 |
| Taiwanese | 91.4 /100 | #125 | Exceptional $107,295 |
| Serbians | 90.8 /100 | #126 | Exceptional $107,157 |
| Lebanese | 90.5 /100 | #127 | Exceptional $107,086 |
| Immigrants | Ethiopia | 90.0 /100 | #128 | Excellent $106,969 |
| Arabs | 89.9 /100 | #129 | Excellent $106,952 |
| Brazilians | 89.8 /100 | #130 | Excellent $106,942 |
| Canadians | 88.1 /100 | #131 | Excellent $106,597 |