Haitian vs Egyptian Median Female Earnings
COMPARE
Haitian
Egyptian
Median Female Earnings
Median Female Earnings Comparison
Haitians
Egyptians
$36,374
MEDIAN FEMALE EARNINGS
0.1/ 100
METRIC RATING
282nd/ 347
METRIC RANK
$43,305
MEDIAN FEMALE EARNINGS
99.9/ 100
METRIC RATING
55th/ 347
METRIC RANK
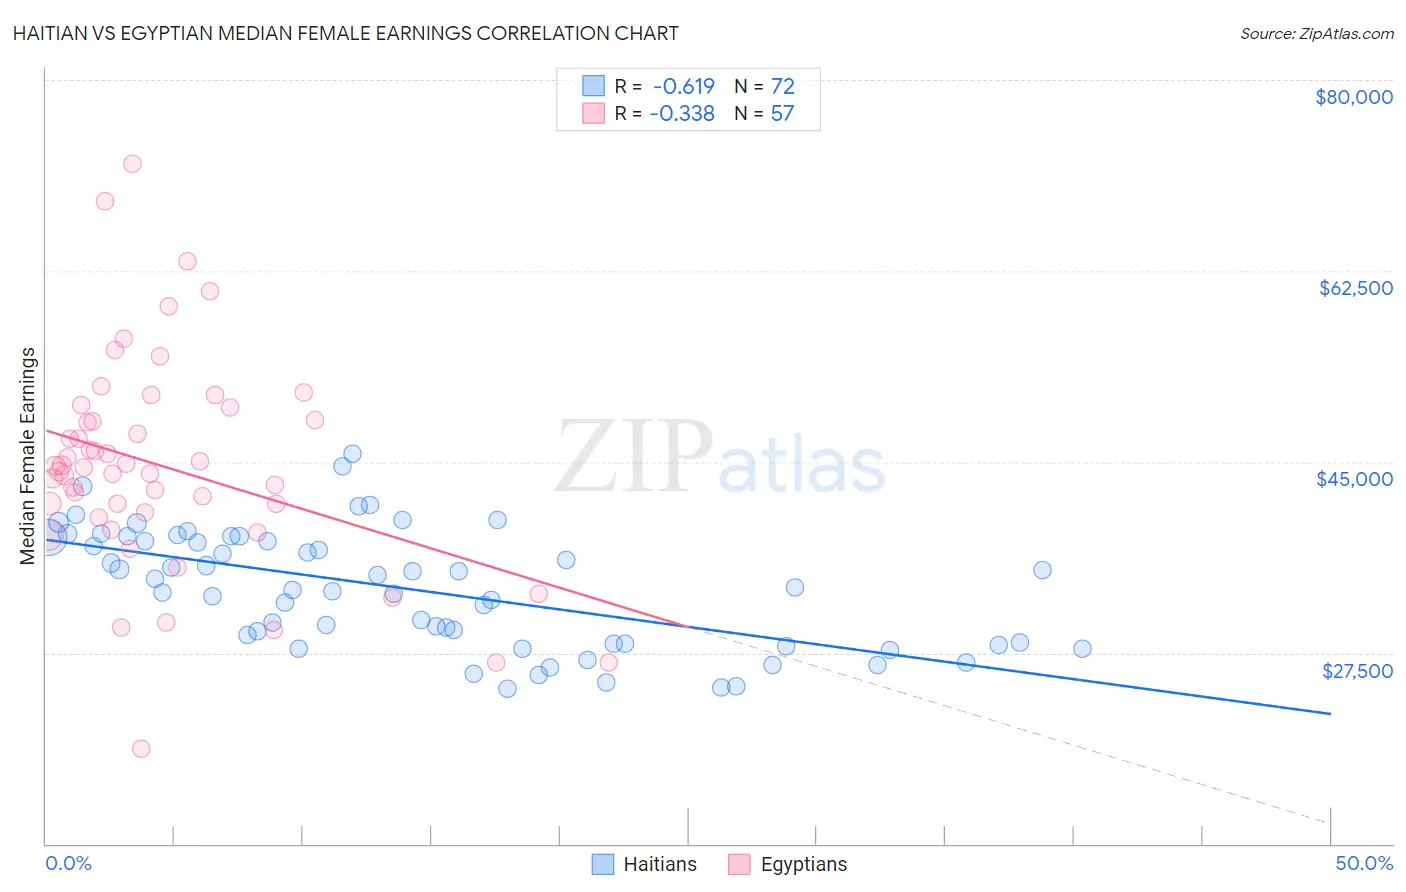
Haitian vs Egyptian Median Female Earnings Correlation Chart
The statistical analysis conducted on geographies consisting of 287,899,387 people shows a significant negative correlation between the proportion of Haitians and median female earnings in the United States with a correlation coefficient (R) of -0.619 and weighted average of $36,374. Similarly, the statistical analysis conducted on geographies consisting of 276,887,423 people shows a mild negative correlation between the proportion of Egyptians and median female earnings in the United States with a correlation coefficient (R) of -0.338 and weighted average of $43,305, a difference of 19.1%.
Median Female Earnings Correlation Summary
| Measurement | Haitian | Egyptian |
| Minimum | $24,245 | $18,750 |
| Maximum | $45,799 | $72,362 |
| Range | $21,554 | $53,612 |
| Mean | $33,333 | $44,581 |
| Median | $33,334 | $44,449 |
| Interquartile 25% (IQ1) | $28,287 | $40,134 |
| Interquartile 75% (IQ3) | $37,934 | $49,358 |
| Interquartile Range (IQR) | $9,647 | $9,224 |
| Standard Deviation (Sample) | $5,376 | $9,878 |
| Standard Deviation (Population) | $5,339 | $9,791 |
Similar Demographics by Median Female Earnings
Demographics Similar to Haitians by Median Female Earnings
In terms of median female earnings, the demographic groups most similar to Haitians are Spanish American ($36,391, a difference of 0.050%), Iroquois ($36,408, a difference of 0.090%), Immigrants from Caribbean ($36,414, a difference of 0.11%), U.S. Virgin Islander ($36,424, a difference of 0.14%), and Marshallese ($36,459, a difference of 0.24%).
| Demographics | Rating | Rank | Median Female Earnings |
| Africans | 0.1 /100 | #275 | Tragic $36,530 |
| Central Americans | 0.1 /100 | #276 | Tragic $36,492 |
| Marshallese | 0.1 /100 | #277 | Tragic $36,459 |
| U.S. Virgin Islanders | 0.1 /100 | #278 | Tragic $36,424 |
| Immigrants | Caribbean | 0.1 /100 | #279 | Tragic $36,414 |
| Iroquois | 0.1 /100 | #280 | Tragic $36,408 |
| Spanish Americans | 0.1 /100 | #281 | Tragic $36,391 |
| Haitians | 0.1 /100 | #282 | Tragic $36,374 |
| Immigrants | Haiti | 0.1 /100 | #283 | Tragic $36,203 |
| Indonesians | 0.1 /100 | #284 | Tragic $36,140 |
| Paiute | 0.1 /100 | #285 | Tragic $36,056 |
| Osage | 0.0 /100 | #286 | Tragic $36,034 |
| Immigrants | Nicaragua | 0.0 /100 | #287 | Tragic $36,023 |
| Immigrants | Zaire | 0.0 /100 | #288 | Tragic $36,017 |
| Bangladeshis | 0.0 /100 | #289 | Tragic $35,960 |
Demographics Similar to Egyptians by Median Female Earnings
In terms of median female earnings, the demographic groups most similar to Egyptians are Immigrants from Eastern Europe ($43,309, a difference of 0.010%), Australian ($43,308, a difference of 0.010%), Immigrants from Lithuania ($43,317, a difference of 0.030%), Immigrants from Croatia ($43,258, a difference of 0.11%), and Maltese ($43,357, a difference of 0.12%).
| Demographics | Rating | Rank | Median Female Earnings |
| Immigrants | Indonesia | 100.0 /100 | #48 | Exceptional $43,412 |
| Immigrants | Serbia | 100.0 /100 | #49 | Exceptional $43,385 |
| Immigrants | Uzbekistan | 100.0 /100 | #50 | Exceptional $43,363 |
| Maltese | 100.0 /100 | #51 | Exceptional $43,357 |
| Immigrants | Lithuania | 99.9 /100 | #52 | Exceptional $43,317 |
| Immigrants | Eastern Europe | 99.9 /100 | #53 | Exceptional $43,309 |
| Australians | 99.9 /100 | #54 | Exceptional $43,308 |
| Egyptians | 99.9 /100 | #55 | Exceptional $43,305 |
| Immigrants | Croatia | 99.9 /100 | #56 | Exceptional $43,258 |
| Ethiopians | 99.9 /100 | #57 | Exceptional $43,243 |
| Paraguayans | 99.9 /100 | #58 | Exceptional $43,173 |
| Estonians | 99.9 /100 | #59 | Exceptional $43,106 |
| Immigrants | Latvia | 99.9 /100 | #60 | Exceptional $43,099 |
| Immigrants | Bulgaria | 99.9 /100 | #61 | Exceptional $43,085 |
| Afghans | 99.9 /100 | #62 | Exceptional $43,077 |