Haitian vs Crow Median Female Earnings
COMPARE
Haitian
Crow
Median Female Earnings
Median Female Earnings Comparison
Haitians
Crow
$36,374
MEDIAN FEMALE EARNINGS
0.1/ 100
METRIC RATING
282nd/ 347
METRIC RANK
$35,266
MEDIAN FEMALE EARNINGS
0.0/ 100
METRIC RATING
304th/ 347
METRIC RANK
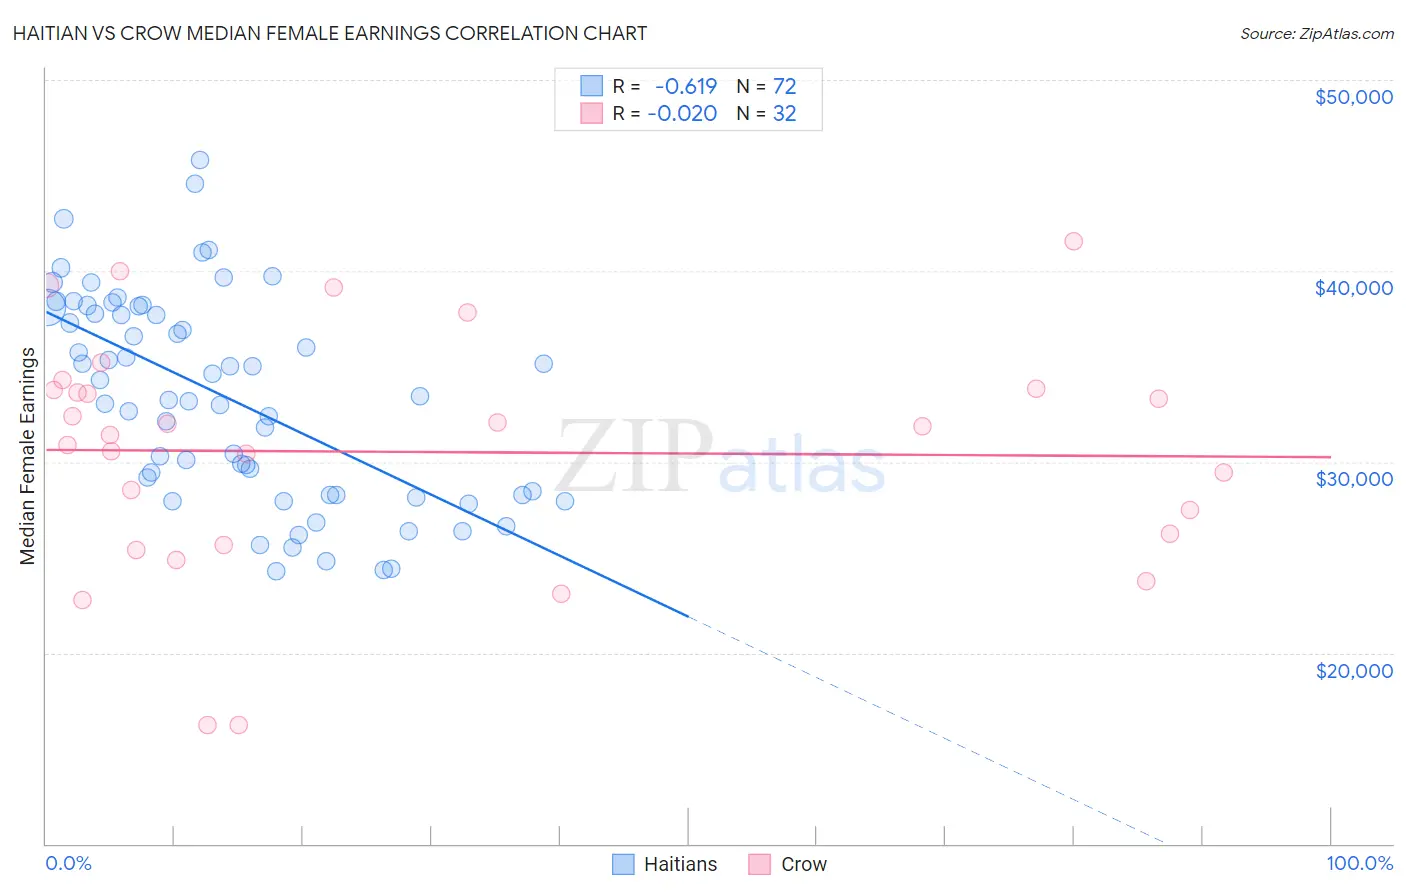
Haitian vs Crow Median Female Earnings Correlation Chart
The statistical analysis conducted on geographies consisting of 287,899,387 people shows a significant negative correlation between the proportion of Haitians and median female earnings in the United States with a correlation coefficient (R) of -0.619 and weighted average of $36,374. Similarly, the statistical analysis conducted on geographies consisting of 59,190,197 people shows no correlation between the proportion of Crow and median female earnings in the United States with a correlation coefficient (R) of -0.020 and weighted average of $35,266, a difference of 3.1%.
Median Female Earnings Correlation Summary
| Measurement | Haitian | Crow |
| Minimum | $24,245 | $16,250 |
| Maximum | $45,799 | $41,563 |
| Range | $21,554 | $25,313 |
| Mean | $33,333 | $30,518 |
| Median | $33,334 | $31,642 |
| Interquartile 25% (IQ1) | $28,287 | $25,950 |
| Interquartile 75% (IQ3) | $37,934 | $33,807 |
| Interquartile Range (IQR) | $9,647 | $7,857 |
| Standard Deviation (Sample) | $5,376 | $6,205 |
| Standard Deviation (Population) | $5,339 | $6,108 |
Similar Demographics by Median Female Earnings
Demographics Similar to Haitians by Median Female Earnings
In terms of median female earnings, the demographic groups most similar to Haitians are Spanish American ($36,391, a difference of 0.050%), Iroquois ($36,408, a difference of 0.090%), Immigrants from Caribbean ($36,414, a difference of 0.11%), U.S. Virgin Islander ($36,424, a difference of 0.14%), and Marshallese ($36,459, a difference of 0.24%).
| Demographics | Rating | Rank | Median Female Earnings |
| Africans | 0.1 /100 | #275 | Tragic $36,530 |
| Central Americans | 0.1 /100 | #276 | Tragic $36,492 |
| Marshallese | 0.1 /100 | #277 | Tragic $36,459 |
| U.S. Virgin Islanders | 0.1 /100 | #278 | Tragic $36,424 |
| Immigrants | Caribbean | 0.1 /100 | #279 | Tragic $36,414 |
| Iroquois | 0.1 /100 | #280 | Tragic $36,408 |
| Spanish Americans | 0.1 /100 | #281 | Tragic $36,391 |
| Haitians | 0.1 /100 | #282 | Tragic $36,374 |
| Immigrants | Haiti | 0.1 /100 | #283 | Tragic $36,203 |
| Indonesians | 0.1 /100 | #284 | Tragic $36,140 |
| Paiute | 0.1 /100 | #285 | Tragic $36,056 |
| Osage | 0.0 /100 | #286 | Tragic $36,034 |
| Immigrants | Nicaragua | 0.0 /100 | #287 | Tragic $36,023 |
| Immigrants | Zaire | 0.0 /100 | #288 | Tragic $36,017 |
| Bangladeshis | 0.0 /100 | #289 | Tragic $35,960 |
Demographics Similar to Crow by Median Female Earnings
In terms of median female earnings, the demographic groups most similar to Crow are Immigrants from Latin America ($35,307, a difference of 0.11%), Black/African American ($35,315, a difference of 0.14%), Pima ($35,326, a difference of 0.17%), Yuman ($35,377, a difference of 0.31%), and Bahamian ($35,125, a difference of 0.40%).
| Demographics | Rating | Rank | Median Female Earnings |
| Hmong | 0.0 /100 | #297 | Tragic $35,498 |
| Immigrants | Micronesia | 0.0 /100 | #298 | Tragic $35,477 |
| Immigrants | Guatemala | 0.0 /100 | #299 | Tragic $35,444 |
| Yuman | 0.0 /100 | #300 | Tragic $35,377 |
| Pima | 0.0 /100 | #301 | Tragic $35,326 |
| Blacks/African Americans | 0.0 /100 | #302 | Tragic $35,315 |
| Immigrants | Latin America | 0.0 /100 | #303 | Tragic $35,307 |
| Crow | 0.0 /100 | #304 | Tragic $35,266 |
| Bahamians | 0.0 /100 | #305 | Tragic $35,125 |
| Fijians | 0.0 /100 | #306 | Tragic $35,114 |
| Sioux | 0.0 /100 | #307 | Tragic $35,063 |
| Immigrants | Bahamas | 0.0 /100 | #308 | Tragic $35,027 |
| Hondurans | 0.0 /100 | #309 | Tragic $35,013 |
| Chippewa | 0.0 /100 | #310 | Tragic $35,003 |
| Ute | 0.0 /100 | #311 | Tragic $34,960 |