Haitian vs Immigrants from Italy Median Female Earnings
COMPARE
Haitian
Immigrants from Italy
Median Female Earnings
Median Female Earnings Comparison
Haitians
Immigrants from Italy
$36,374
MEDIAN FEMALE EARNINGS
0.1/ 100
METRIC RATING
282nd/ 347
METRIC RANK
$42,446
MEDIAN FEMALE EARNINGS
99.7/ 100
METRIC RATING
76th/ 347
METRIC RANK
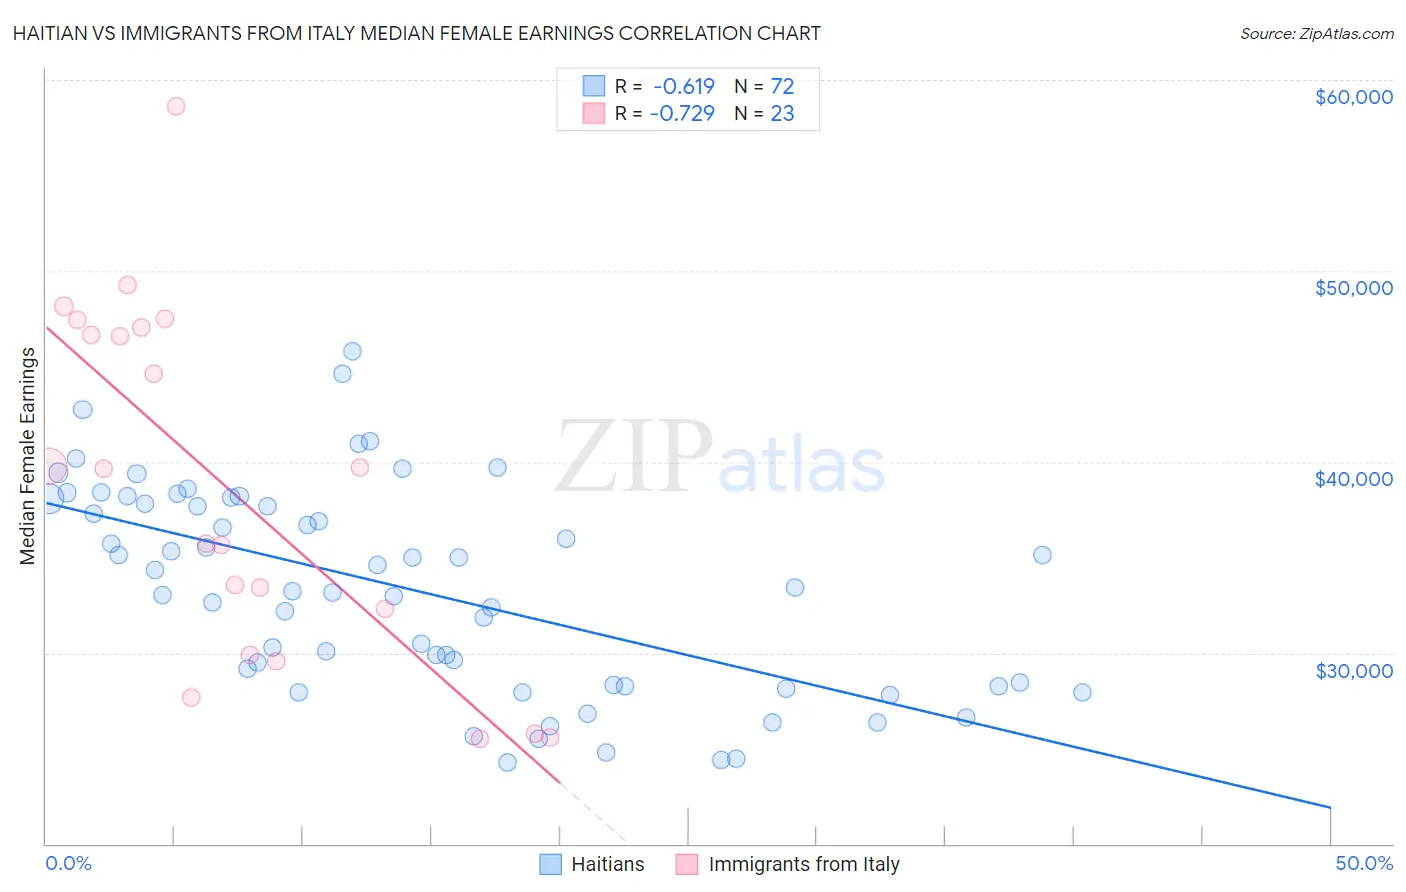
Haitian vs Immigrants from Italy Median Female Earnings Correlation Chart
The statistical analysis conducted on geographies consisting of 287,899,387 people shows a significant negative correlation between the proportion of Haitians and median female earnings in the United States with a correlation coefficient (R) of -0.619 and weighted average of $36,374. Similarly, the statistical analysis conducted on geographies consisting of 324,085,917 people shows a strong negative correlation between the proportion of Immigrants from Italy and median female earnings in the United States with a correlation coefficient (R) of -0.729 and weighted average of $42,446, a difference of 16.7%.
Median Female Earnings Correlation Summary
| Measurement | Haitian | Immigrants from Italy |
| Minimum | $24,245 | $25,509 |
| Maximum | $45,799 | $58,594 |
| Range | $21,554 | $33,085 |
| Mean | $33,333 | $38,670 |
| Median | $33,334 | $39,639 |
| Interquartile 25% (IQ1) | $28,287 | $29,886 |
| Interquartile 75% (IQ3) | $37,934 | $47,033 |
| Interquartile Range (IQR) | $9,647 | $17,147 |
| Standard Deviation (Sample) | $5,376 | $9,280 |
| Standard Deviation (Population) | $5,339 | $9,076 |
Similar Demographics by Median Female Earnings
Demographics Similar to Haitians by Median Female Earnings
In terms of median female earnings, the demographic groups most similar to Haitians are Spanish American ($36,391, a difference of 0.050%), Iroquois ($36,408, a difference of 0.090%), Immigrants from Caribbean ($36,414, a difference of 0.11%), U.S. Virgin Islander ($36,424, a difference of 0.14%), and Marshallese ($36,459, a difference of 0.24%).
| Demographics | Rating | Rank | Median Female Earnings |
| Africans | 0.1 /100 | #275 | Tragic $36,530 |
| Central Americans | 0.1 /100 | #276 | Tragic $36,492 |
| Marshallese | 0.1 /100 | #277 | Tragic $36,459 |
| U.S. Virgin Islanders | 0.1 /100 | #278 | Tragic $36,424 |
| Immigrants | Caribbean | 0.1 /100 | #279 | Tragic $36,414 |
| Iroquois | 0.1 /100 | #280 | Tragic $36,408 |
| Spanish Americans | 0.1 /100 | #281 | Tragic $36,391 |
| Haitians | 0.1 /100 | #282 | Tragic $36,374 |
| Immigrants | Haiti | 0.1 /100 | #283 | Tragic $36,203 |
| Indonesians | 0.1 /100 | #284 | Tragic $36,140 |
| Paiute | 0.1 /100 | #285 | Tragic $36,056 |
| Osage | 0.0 /100 | #286 | Tragic $36,034 |
| Immigrants | Nicaragua | 0.0 /100 | #287 | Tragic $36,023 |
| Immigrants | Zaire | 0.0 /100 | #288 | Tragic $36,017 |
| Bangladeshis | 0.0 /100 | #289 | Tragic $35,960 |
Demographics Similar to Immigrants from Italy by Median Female Earnings
In terms of median female earnings, the demographic groups most similar to Immigrants from Italy are New Zealander ($42,446, a difference of 0.0%), Immigrants from Albania ($42,388, a difference of 0.14%), Immigrants from Kazakhstan ($42,386, a difference of 0.14%), Immigrants from South Africa ($42,508, a difference of 0.15%), and Mongolian ($42,542, a difference of 0.23%).
| Demographics | Rating | Rank | Median Female Earnings |
| Immigrants | Spain | 99.8 /100 | #69 | Exceptional $42,815 |
| Immigrants | Ethiopia | 99.8 /100 | #70 | Exceptional $42,744 |
| Immigrants | Romania | 99.8 /100 | #71 | Exceptional $42,718 |
| Albanians | 99.8 /100 | #72 | Exceptional $42,584 |
| Mongolians | 99.7 /100 | #73 | Exceptional $42,542 |
| Immigrants | South Africa | 99.7 /100 | #74 | Exceptional $42,508 |
| New Zealanders | 99.7 /100 | #75 | Exceptional $42,446 |
| Immigrants | Italy | 99.7 /100 | #76 | Exceptional $42,446 |
| Immigrants | Albania | 99.6 /100 | #77 | Exceptional $42,388 |
| Immigrants | Kazakhstan | 99.6 /100 | #78 | Exceptional $42,386 |
| Greeks | 99.6 /100 | #79 | Exceptional $42,336 |
| Immigrants | Moldova | 99.6 /100 | #80 | Exceptional $42,304 |
| Immigrants | Southern Europe | 99.5 /100 | #81 | Exceptional $42,275 |
| Immigrants | Morocco | 99.5 /100 | #82 | Exceptional $42,229 |
| Immigrants | Sierra Leone | 99.5 /100 | #83 | Exceptional $42,214 |