Haitian vs Immigrants from Bahamas Births to Unmarried Women
COMPARE
Haitian
Immigrants from Bahamas
Births to Unmarried Women
Births to Unmarried Women Comparison
Haitians
Immigrants from Bahamas
38.6%
BIRTHS TO UNMARRIED WOMEN
0.0/ 100
METRIC RATING
301st/ 347
METRIC RANK
40.1%
BIRTHS TO UNMARRIED WOMEN
0.0/ 100
METRIC RATING
318th/ 347
METRIC RANK
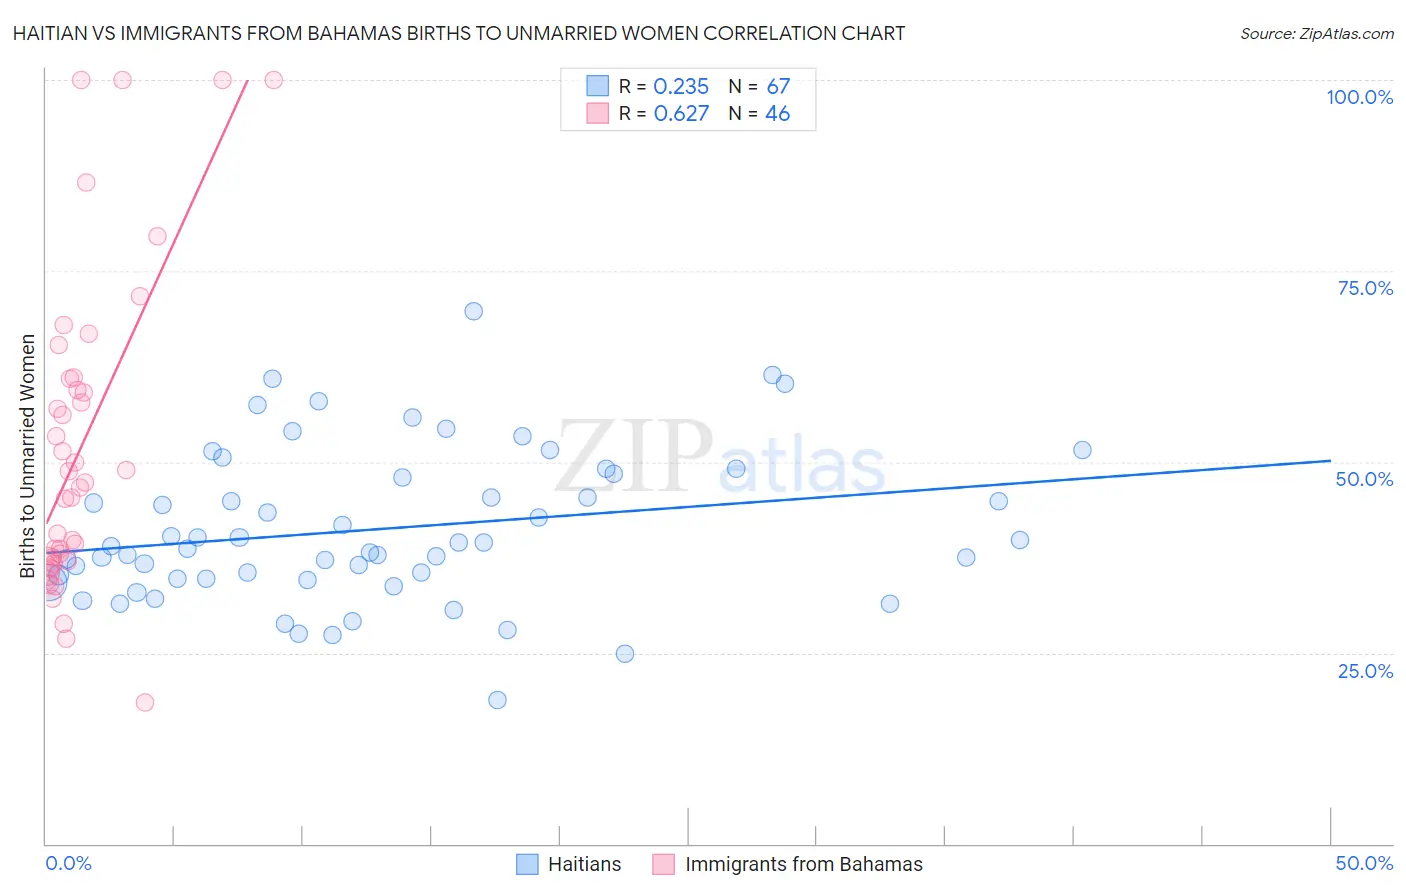
Haitian vs Immigrants from Bahamas Births to Unmarried Women Correlation Chart
The statistical analysis conducted on geographies consisting of 274,356,790 people shows a weak positive correlation between the proportion of Haitians and percentage of births to unmarried women in the United States with a correlation coefficient (R) of 0.235 and weighted average of 38.6%. Similarly, the statistical analysis conducted on geographies consisting of 103,055,032 people shows a significant positive correlation between the proportion of Immigrants from Bahamas and percentage of births to unmarried women in the United States with a correlation coefficient (R) of 0.627 and weighted average of 40.1%, a difference of 4.0%.
Births to Unmarried Women Correlation Summary
| Measurement | Haitian | Immigrants from Bahamas |
| Minimum | 18.8% | 18.5% |
| Maximum | 69.7% | 100.0% |
| Range | 50.9% | 81.5% |
| Mean | 41.2% | 51.9% |
| Median | 38.9% | 47.0% |
| Interquartile 25% (IQ1) | 34.7% | 37.0% |
| Interquartile 75% (IQ3) | 48.5% | 60.9% |
| Interquartile Range (IQR) | 13.8% | 23.9% |
| Standard Deviation (Sample) | 10.0% | 20.6% |
| Standard Deviation (Population) | 9.9% | 20.3% |
Demographics Similar to Haitians and Immigrants from Bahamas by Births to Unmarried Women
In terms of births to unmarried women, the demographic groups most similar to Haitians are Immigrants from West Indies (38.6%, a difference of 0.010%), Spanish American (38.6%, a difference of 0.070%), Honduran (38.7%, a difference of 0.24%), Immigrants from Jamaica (38.8%, a difference of 0.56%), and Yaqui (38.8%, a difference of 0.61%). Similarly, the demographic groups most similar to Immigrants from Bahamas are Immigrants from Dominican Republic (40.1%, a difference of 0.070%), Yakama (40.3%, a difference of 0.56%), Apache (39.9%, a difference of 0.62%), Dominican (39.8%, a difference of 0.68%), and Immigrants from Caribbean (39.8%, a difference of 0.72%).
| Demographics | Rating | Rank | Births to Unmarried Women |
| Spanish Americans | 0.0 /100 | #299 | Tragic 38.6% |
| Immigrants | West Indies | 0.0 /100 | #300 | Tragic 38.6% |
| Haitians | 0.0 /100 | #301 | Tragic 38.6% |
| Hondurans | 0.0 /100 | #302 | Tragic 38.7% |
| Immigrants | Jamaica | 0.0 /100 | #303 | Tragic 38.8% |
| Yaqui | 0.0 /100 | #304 | Tragic 38.8% |
| Immigrants | Haiti | 0.0 /100 | #305 | Tragic 38.9% |
| Central American Indians | 0.0 /100 | #306 | Tragic 39.0% |
| Immigrants | Honduras | 0.0 /100 | #307 | Tragic 39.3% |
| Aleuts | 0.0 /100 | #308 | Tragic 39.3% |
| Cubans | 0.0 /100 | #309 | Tragic 39.4% |
| Immigrants | Dominica | 0.0 /100 | #310 | Tragic 39.5% |
| Immigrants | Azores | 0.0 /100 | #311 | Tragic 39.6% |
| U.S. Virgin Islanders | 0.0 /100 | #312 | Tragic 39.6% |
| Africans | 0.0 /100 | #313 | Tragic 39.7% |
| Immigrants | Caribbean | 0.0 /100 | #314 | Tragic 39.8% |
| Dominicans | 0.0 /100 | #315 | Tragic 39.8% |
| Apache | 0.0 /100 | #316 | Tragic 39.9% |
| Immigrants | Dominican Republic | 0.0 /100 | #317 | Tragic 40.1% |
| Immigrants | Bahamas | 0.0 /100 | #318 | Tragic 40.1% |
| Yakama | 0.0 /100 | #319 | Tragic 40.3% |