Haitian vs Delaware Median Earnings
COMPARE
Haitian
Delaware
Median Earnings
Median Earnings Comparison
Haitians
Delaware
$40,918
MEDIAN EARNINGS
0.0/ 100
METRIC RATING
303rd/ 347
METRIC RANK
$44,783
MEDIAN EARNINGS
9.0/ 100
METRIC RATING
232nd/ 347
METRIC RANK
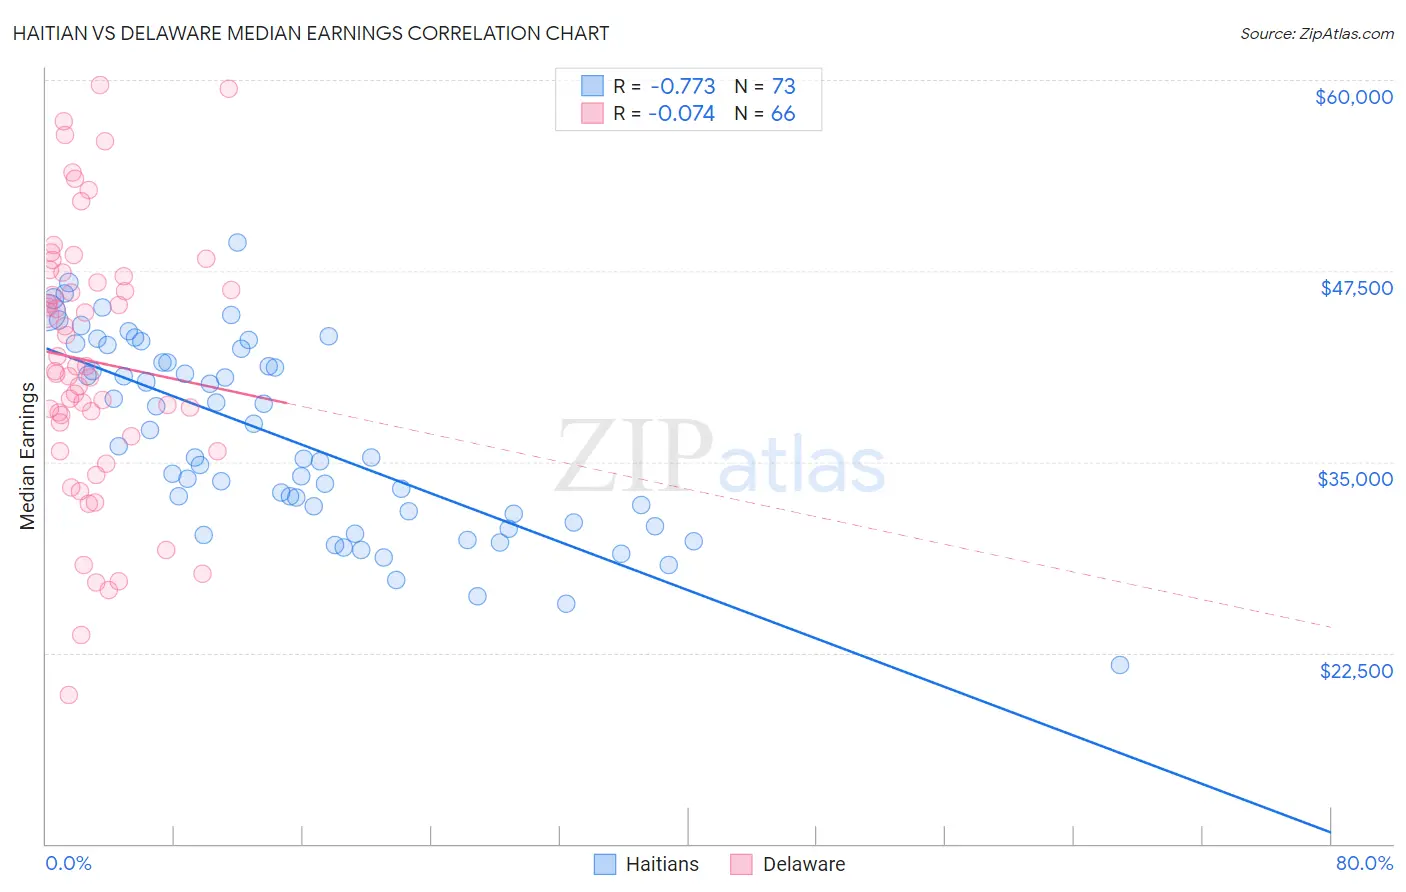
Haitian vs Delaware Median Earnings Correlation Chart
The statistical analysis conducted on geographies consisting of 288,009,020 people shows a strong negative correlation between the proportion of Haitians and median earnings in the United States with a correlation coefficient (R) of -0.773 and weighted average of $40,918. Similarly, the statistical analysis conducted on geographies consisting of 96,235,383 people shows a slight negative correlation between the proportion of Delaware and median earnings in the United States with a correlation coefficient (R) of -0.074 and weighted average of $44,783, a difference of 9.5%.
Median Earnings Correlation Summary
| Measurement | Haitian | Delaware |
| Minimum | $21,741 | $19,766 |
| Maximum | $49,370 | $59,711 |
| Range | $27,629 | $39,945 |
| Mean | $36,539 | $41,572 |
| Median | $35,319 | $41,074 |
| Interquartile 25% (IQ1) | $31,314 | $36,711 |
| Interquartile 75% (IQ3) | $41,959 | $47,149 |
| Interquartile Range (IQR) | $10,645 | $10,438 |
| Standard Deviation (Sample) | $6,179 | $8,740 |
| Standard Deviation (Population) | $6,136 | $8,674 |
Similar Demographics by Median Earnings
Demographics Similar to Haitians by Median Earnings
In terms of median earnings, the demographic groups most similar to Haitians are Shoshone ($40,932, a difference of 0.030%), Immigrants from Guatemala ($40,851, a difference of 0.16%), Ute ($41,051, a difference of 0.32%), Immigrants from Latin America ($41,049, a difference of 0.32%), and Immigrants from Caribbean ($41,119, a difference of 0.49%).
| Demographics | Rating | Rank | Median Earnings |
| Cherokee | 0.1 /100 | #296 | Tragic $41,252 |
| Guatemalans | 0.1 /100 | #297 | Tragic $41,205 |
| Immigrants | Micronesia | 0.1 /100 | #298 | Tragic $41,133 |
| Immigrants | Caribbean | 0.1 /100 | #299 | Tragic $41,119 |
| Ute | 0.1 /100 | #300 | Tragic $41,051 |
| Immigrants | Latin America | 0.1 /100 | #301 | Tragic $41,049 |
| Shoshone | 0.0 /100 | #302 | Tragic $40,932 |
| Haitians | 0.0 /100 | #303 | Tragic $40,918 |
| Immigrants | Guatemala | 0.0 /100 | #304 | Tragic $40,851 |
| Chickasaw | 0.0 /100 | #305 | Tragic $40,672 |
| Yaqui | 0.0 /100 | #306 | Tragic $40,647 |
| Hondurans | 0.0 /100 | #307 | Tragic $40,638 |
| Cubans | 0.0 /100 | #308 | Tragic $40,619 |
| Immigrants | Haiti | 0.0 /100 | #309 | Tragic $40,550 |
| Apache | 0.0 /100 | #310 | Tragic $40,388 |
Demographics Similar to Delaware by Median Earnings
In terms of median earnings, the demographic groups most similar to Delaware are Immigrants from Sudan ($44,767, a difference of 0.040%), Japanese ($44,825, a difference of 0.090%), Immigrants from Western Africa ($44,893, a difference of 0.24%), Scotch-Irish ($44,924, a difference of 0.32%), and Cape Verdean ($44,640, a difference of 0.32%).
| Demographics | Rating | Rank | Median Earnings |
| Immigrants | Cambodia | 13.2 /100 | #225 | Poor $45,090 |
| Immigrants | Nigeria | 12.2 /100 | #226 | Poor $45,030 |
| Native Hawaiians | 12.2 /100 | #227 | Poor $45,027 |
| Immigrants | Iraq | 11.6 /100 | #228 | Poor $44,988 |
| Scotch-Irish | 10.7 /100 | #229 | Poor $44,924 |
| Immigrants | Western Africa | 10.3 /100 | #230 | Poor $44,893 |
| Japanese | 9.5 /100 | #231 | Tragic $44,825 |
| Delaware | 9.0 /100 | #232 | Tragic $44,783 |
| Immigrants | Sudan | 8.8 /100 | #233 | Tragic $44,767 |
| Cape Verdeans | 7.5 /100 | #234 | Tragic $44,640 |
| Venezuelans | 6.9 /100 | #235 | Tragic $44,580 |
| British West Indians | 6.7 /100 | #236 | Tragic $44,552 |
| Immigrants | Ecuador | 5.9 /100 | #237 | Tragic $44,462 |
| Sudanese | 5.6 /100 | #238 | Tragic $44,419 |
| Senegalese | 5.3 /100 | #239 | Tragic $44,373 |