Guatemalan vs Guyanese Median Family Income
COMPARE
Guatemalan
Guyanese
Median Family Income
Median Family Income Comparison
Guatemalans
Guyanese
$88,295
MEDIAN FAMILY INCOME
0.1/ 100
METRIC RATING
285th/ 347
METRIC RANK
$93,373
MEDIAN FAMILY INCOME
0.9/ 100
METRIC RATING
246th/ 347
METRIC RANK
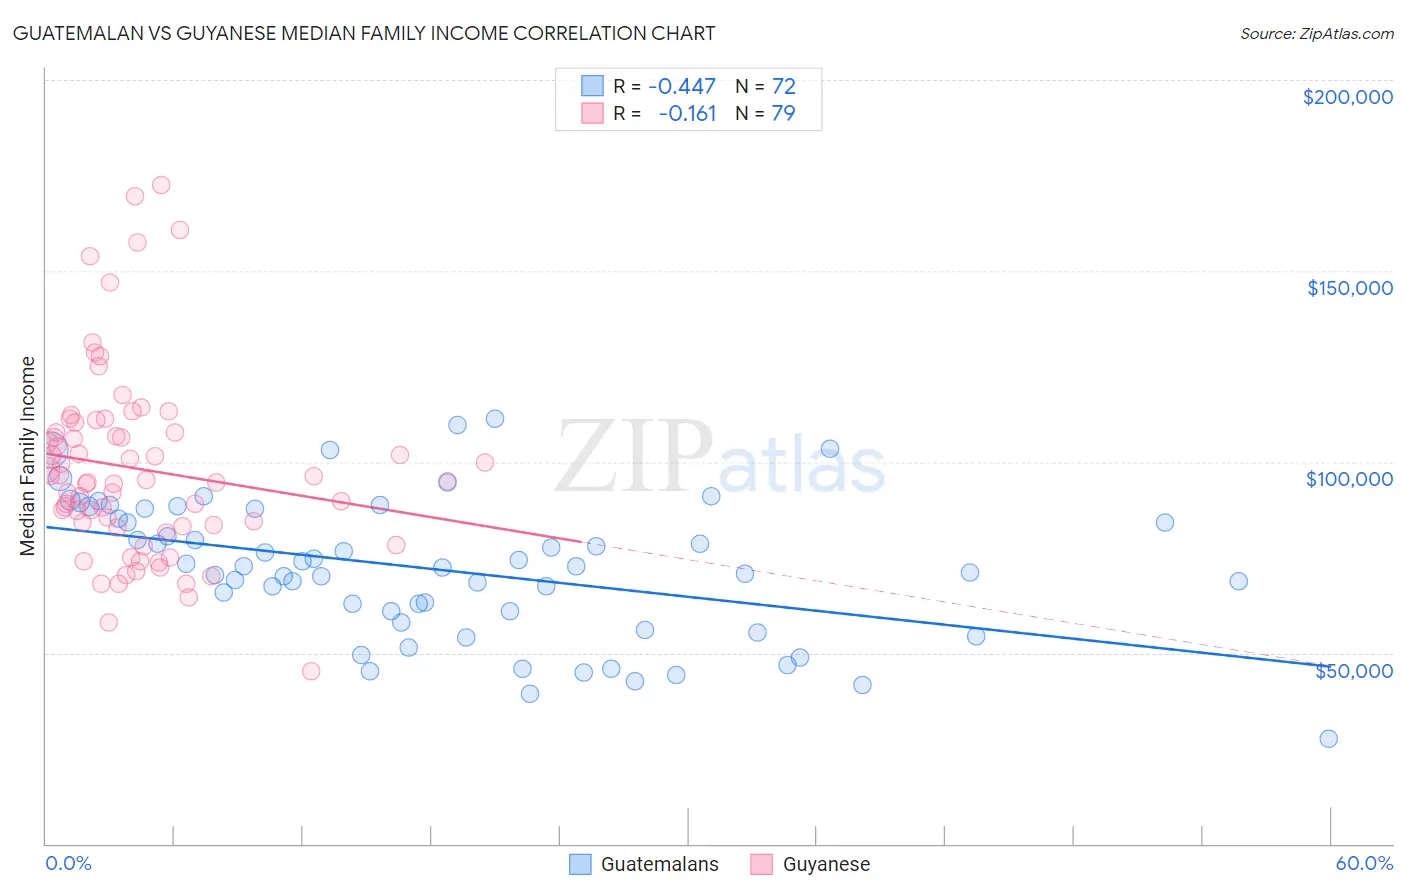
Guatemalan vs Guyanese Median Family Income Correlation Chart
The statistical analysis conducted on geographies consisting of 409,160,818 people shows a moderate negative correlation between the proportion of Guatemalans and median family income in the United States with a correlation coefficient (R) of -0.447 and weighted average of $88,295. Similarly, the statistical analysis conducted on geographies consisting of 176,743,960 people shows a poor negative correlation between the proportion of Guyanese and median family income in the United States with a correlation coefficient (R) of -0.161 and weighted average of $93,373, a difference of 5.8%.
Median Family Income Correlation Summary
| Measurement | Guatemalan | Guyanese |
| Minimum | $27,406 | $45,100 |
| Maximum | $111,362 | $172,597 |
| Range | $83,956 | $127,497 |
| Mean | $71,713 | $98,114 |
| Median | $72,451 | $94,843 |
| Interquartile 25% (IQ1) | $59,369 | $83,119 |
| Interquartile 75% (IQ3) | $86,431 | $107,693 |
| Interquartile Range (IQR) | $27,062 | $24,574 |
| Standard Deviation (Sample) | $18,247 | $24,573 |
| Standard Deviation (Population) | $18,120 | $24,417 |
Similar Demographics by Median Family Income
Demographics Similar to Guatemalans by Median Family Income
In terms of median family income, the demographic groups most similar to Guatemalans are Indonesian ($88,301, a difference of 0.010%), Immigrants from Nicaragua ($88,267, a difference of 0.030%), Potawatomi ($88,265, a difference of 0.030%), Bangladeshi ($88,358, a difference of 0.070%), and Cherokee ($88,209, a difference of 0.10%).
| Demographics | Rating | Rank | Median Family Income |
| Immigrants | Grenada | 0.1 /100 | #278 | Tragic $89,249 |
| Immigrants | Belize | 0.1 /100 | #279 | Tragic $89,197 |
| British West Indians | 0.1 /100 | #280 | Tragic $88,987 |
| Blackfeet | 0.1 /100 | #281 | Tragic $88,717 |
| Comanche | 0.1 /100 | #282 | Tragic $88,556 |
| Bangladeshis | 0.1 /100 | #283 | Tragic $88,358 |
| Indonesians | 0.1 /100 | #284 | Tragic $88,301 |
| Guatemalans | 0.1 /100 | #285 | Tragic $88,295 |
| Immigrants | Nicaragua | 0.1 /100 | #286 | Tragic $88,267 |
| Potawatomi | 0.1 /100 | #287 | Tragic $88,265 |
| Cherokee | 0.1 /100 | #288 | Tragic $88,209 |
| Central American Indians | 0.1 /100 | #289 | Tragic $88,034 |
| Shoshone | 0.1 /100 | #290 | Tragic $87,872 |
| Immigrants | Cabo Verde | 0.1 /100 | #291 | Tragic $87,830 |
| Africans | 0.1 /100 | #292 | Tragic $87,820 |
Demographics Similar to Guyanese by Median Family Income
In terms of median family income, the demographic groups most similar to Guyanese are Immigrants from Middle Africa ($93,593, a difference of 0.23%), Subsaharan African ($93,748, a difference of 0.40%), Immigrants from Senegal ($92,912, a difference of 0.50%), German Russian ($93,858, a difference of 0.52%), and French American Indian ($92,872, a difference of 0.54%).
| Demographics | Rating | Rank | Median Family Income |
| Salvadorans | 1.2 /100 | #239 | Tragic $94,109 |
| Somalis | 1.2 /100 | #240 | Tragic $94,085 |
| Immigrants | Trinidad and Tobago | 1.2 /100 | #241 | Tragic $93,988 |
| Barbadians | 1.1 /100 | #242 | Tragic $93,919 |
| German Russians | 1.1 /100 | #243 | Tragic $93,858 |
| Sub-Saharan Africans | 1.0 /100 | #244 | Tragic $93,748 |
| Immigrants | Middle Africa | 1.0 /100 | #245 | Tragic $93,593 |
| Guyanese | 0.9 /100 | #246 | Tragic $93,373 |
| Immigrants | Senegal | 0.7 /100 | #247 | Tragic $92,912 |
| French American Indians | 0.7 /100 | #248 | Tragic $92,872 |
| Immigrants | Ecuador | 0.7 /100 | #249 | Tragic $92,837 |
| West Indians | 0.6 /100 | #250 | Tragic $92,765 |
| Immigrants | Somalia | 0.6 /100 | #251 | Tragic $92,609 |
| Immigrants | El Salvador | 0.6 /100 | #252 | Tragic $92,545 |
| Immigrants | Guyana | 0.6 /100 | #253 | Tragic $92,513 |