Guatemalan vs Pakistani Median Family Income
COMPARE
Guatemalan
Pakistani
Median Family Income
Median Family Income Comparison
Guatemalans
Pakistanis
$88,295
MEDIAN FAMILY INCOME
0.1/ 100
METRIC RATING
285th/ 347
METRIC RANK
$107,390
MEDIAN FAMILY INCOME
91.7/ 100
METRIC RATING
124th/ 347
METRIC RANK
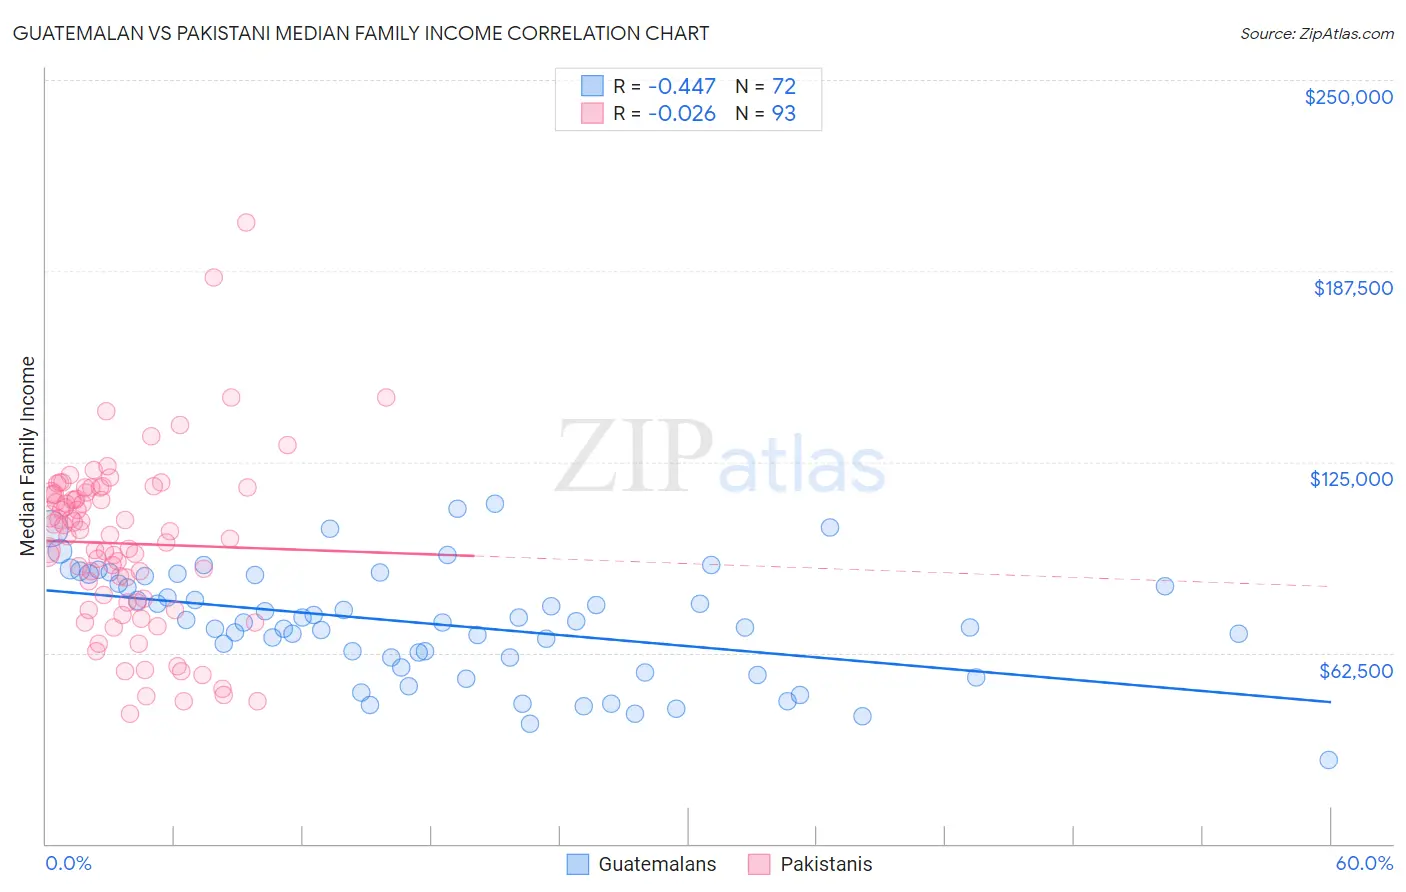
Guatemalan vs Pakistani Median Family Income Correlation Chart
The statistical analysis conducted on geographies consisting of 409,160,818 people shows a moderate negative correlation between the proportion of Guatemalans and median family income in the United States with a correlation coefficient (R) of -0.447 and weighted average of $88,295. Similarly, the statistical analysis conducted on geographies consisting of 335,122,769 people shows no correlation between the proportion of Pakistanis and median family income in the United States with a correlation coefficient (R) of -0.026 and weighted average of $107,390, a difference of 21.6%.
Median Family Income Correlation Summary
| Measurement | Guatemalan | Pakistani |
| Minimum | $27,406 | $42,414 |
| Maximum | $111,362 | $203,281 |
| Range | $83,956 | $160,867 |
| Mean | $71,713 | $98,287 |
| Median | $72,451 | $101,250 |
| Interquartile 25% (IQ1) | $59,369 | $78,908 |
| Interquartile 75% (IQ3) | $86,431 | $114,990 |
| Interquartile Range (IQR) | $27,062 | $36,082 |
| Standard Deviation (Sample) | $18,247 | $28,141 |
| Standard Deviation (Population) | $18,120 | $27,989 |
Similar Demographics by Median Family Income
Demographics Similar to Guatemalans by Median Family Income
In terms of median family income, the demographic groups most similar to Guatemalans are Indonesian ($88,301, a difference of 0.010%), Immigrants from Nicaragua ($88,267, a difference of 0.030%), Potawatomi ($88,265, a difference of 0.030%), Bangladeshi ($88,358, a difference of 0.070%), and Cherokee ($88,209, a difference of 0.10%).
| Demographics | Rating | Rank | Median Family Income |
| Immigrants | Grenada | 0.1 /100 | #278 | Tragic $89,249 |
| Immigrants | Belize | 0.1 /100 | #279 | Tragic $89,197 |
| British West Indians | 0.1 /100 | #280 | Tragic $88,987 |
| Blackfeet | 0.1 /100 | #281 | Tragic $88,717 |
| Comanche | 0.1 /100 | #282 | Tragic $88,556 |
| Bangladeshis | 0.1 /100 | #283 | Tragic $88,358 |
| Indonesians | 0.1 /100 | #284 | Tragic $88,301 |
| Guatemalans | 0.1 /100 | #285 | Tragic $88,295 |
| Immigrants | Nicaragua | 0.1 /100 | #286 | Tragic $88,267 |
| Potawatomi | 0.1 /100 | #287 | Tragic $88,265 |
| Cherokee | 0.1 /100 | #288 | Tragic $88,209 |
| Central American Indians | 0.1 /100 | #289 | Tragic $88,034 |
| Shoshone | 0.1 /100 | #290 | Tragic $87,872 |
| Immigrants | Cabo Verde | 0.1 /100 | #291 | Tragic $87,830 |
| Africans | 0.1 /100 | #292 | Tragic $87,820 |
Demographics Similar to Pakistanis by Median Family Income
In terms of median family income, the demographic groups most similar to Pakistanis are Taiwanese ($107,295, a difference of 0.090%), Carpatho Rusyn ($107,502, a difference of 0.11%), Serbian ($107,157, a difference of 0.22%), Lebanese ($107,086, a difference of 0.28%), and Immigrants from Jordan ($107,715, a difference of 0.30%).
| Demographics | Rating | Rank | Median Family Income |
| Immigrants | Philippines | 94.6 /100 | #117 | Exceptional $108,288 |
| Ethiopians | 94.5 /100 | #118 | Exceptional $108,251 |
| Sri Lankans | 94.5 /100 | #119 | Exceptional $108,234 |
| Immigrants | Northern Africa | 94.3 /100 | #120 | Exceptional $108,161 |
| Europeans | 94.1 /100 | #121 | Exceptional $108,099 |
| Immigrants | Jordan | 92.9 /100 | #122 | Exceptional $107,715 |
| Carpatho Rusyns | 92.2 /100 | #123 | Exceptional $107,502 |
| Pakistanis | 91.7 /100 | #124 | Exceptional $107,390 |
| Taiwanese | 91.4 /100 | #125 | Exceptional $107,295 |
| Serbians | 90.8 /100 | #126 | Exceptional $107,157 |
| Lebanese | 90.5 /100 | #127 | Exceptional $107,086 |
| Immigrants | Ethiopia | 90.0 /100 | #128 | Excellent $106,969 |
| Arabs | 89.9 /100 | #129 | Excellent $106,952 |
| Brazilians | 89.8 /100 | #130 | Excellent $106,942 |
| Canadians | 88.1 /100 | #131 | Excellent $106,597 |