Guatemalan vs Immigrants from Guatemala Median Family Income
COMPARE
Guatemalan
Immigrants from Guatemala
Median Family Income
Median Family Income Comparison
Guatemalans
Immigrants from Guatemala
$88,295
MEDIAN FAMILY INCOME
0.1/ 100
METRIC RATING
285th/ 347
METRIC RANK
$87,191
MEDIAN FAMILY INCOME
0.0/ 100
METRIC RATING
296th/ 347
METRIC RANK
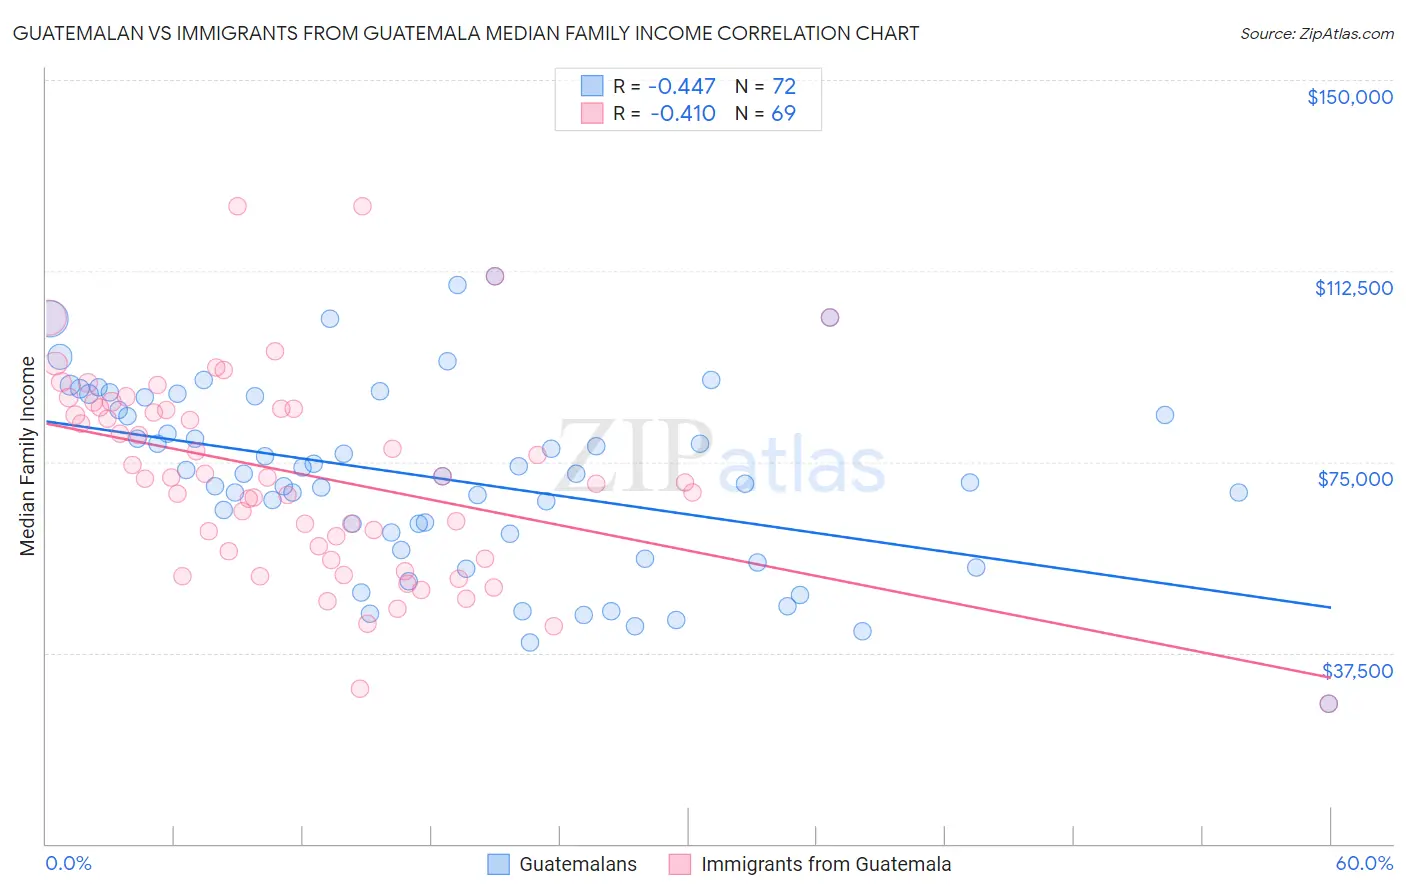
Guatemalan vs Immigrants from Guatemala Median Family Income Correlation Chart
The statistical analysis conducted on geographies consisting of 409,160,818 people shows a moderate negative correlation between the proportion of Guatemalans and median family income in the United States with a correlation coefficient (R) of -0.447 and weighted average of $88,295. Similarly, the statistical analysis conducted on geographies consisting of 377,084,903 people shows a moderate negative correlation between the proportion of Immigrants from Guatemala and median family income in the United States with a correlation coefficient (R) of -0.410 and weighted average of $87,191, a difference of 1.3%.
Median Family Income Correlation Summary
| Measurement | Guatemalan | Immigrants from Guatemala |
| Minimum | $27,406 | $27,406 |
| Maximum | $111,362 | $125,307 |
| Range | $83,956 | $97,901 |
| Mean | $71,713 | $72,495 |
| Median | $72,451 | $71,855 |
| Interquartile 25% (IQ1) | $59,369 | $56,716 |
| Interquartile 75% (IQ3) | $86,431 | $85,579 |
| Interquartile Range (IQR) | $27,062 | $28,864 |
| Standard Deviation (Sample) | $18,247 | $19,880 |
| Standard Deviation (Population) | $18,120 | $19,735 |
Demographics Similar to Guatemalans and Immigrants from Guatemala by Median Family Income
In terms of median family income, the demographic groups most similar to Guatemalans are Indonesian ($88,301, a difference of 0.010%), Immigrants from Nicaragua ($88,267, a difference of 0.030%), Potawatomi ($88,265, a difference of 0.030%), Bangladeshi ($88,358, a difference of 0.070%), and Cherokee ($88,209, a difference of 0.10%). Similarly, the demographic groups most similar to Immigrants from Guatemala are Cajun ($87,157, a difference of 0.040%), Yaqui ($87,289, a difference of 0.11%), Fijian ($87,387, a difference of 0.22%), Immigrants from Latin America ($86,989, a difference of 0.23%), and Chippewa ($86,852, a difference of 0.39%).
| Demographics | Rating | Rank | Median Family Income |
| British West Indians | 0.1 /100 | #280 | Tragic $88,987 |
| Blackfeet | 0.1 /100 | #281 | Tragic $88,717 |
| Comanche | 0.1 /100 | #282 | Tragic $88,556 |
| Bangladeshis | 0.1 /100 | #283 | Tragic $88,358 |
| Indonesians | 0.1 /100 | #284 | Tragic $88,301 |
| Guatemalans | 0.1 /100 | #285 | Tragic $88,295 |
| Immigrants | Nicaragua | 0.1 /100 | #286 | Tragic $88,267 |
| Potawatomi | 0.1 /100 | #287 | Tragic $88,265 |
| Cherokee | 0.1 /100 | #288 | Tragic $88,209 |
| Central American Indians | 0.1 /100 | #289 | Tragic $88,034 |
| Shoshone | 0.1 /100 | #290 | Tragic $87,872 |
| Immigrants | Cabo Verde | 0.1 /100 | #291 | Tragic $87,830 |
| Africans | 0.1 /100 | #292 | Tragic $87,820 |
| Ute | 0.0 /100 | #293 | Tragic $87,596 |
| Fijians | 0.0 /100 | #294 | Tragic $87,387 |
| Yaqui | 0.0 /100 | #295 | Tragic $87,289 |
| Immigrants | Guatemala | 0.0 /100 | #296 | Tragic $87,191 |
| Cajuns | 0.0 /100 | #297 | Tragic $87,157 |
| Immigrants | Latin America | 0.0 /100 | #298 | Tragic $86,989 |
| Chippewa | 0.0 /100 | #299 | Tragic $86,852 |
| Ottawa | 0.0 /100 | #300 | Tragic $86,380 |