Guatemalan vs Immigrants Median Family Income
COMPARE
Guatemalan
Immigrants
Median Family Income
Median Family Income Comparison
Guatemalans
Immigrants
$88,295
MEDIAN FAMILY INCOME
0.1/ 100
METRIC RATING
285th/ 347
METRIC RANK
$100,962
MEDIAN FAMILY INCOME
29.4/ 100
METRIC RATING
190th/ 347
METRIC RANK
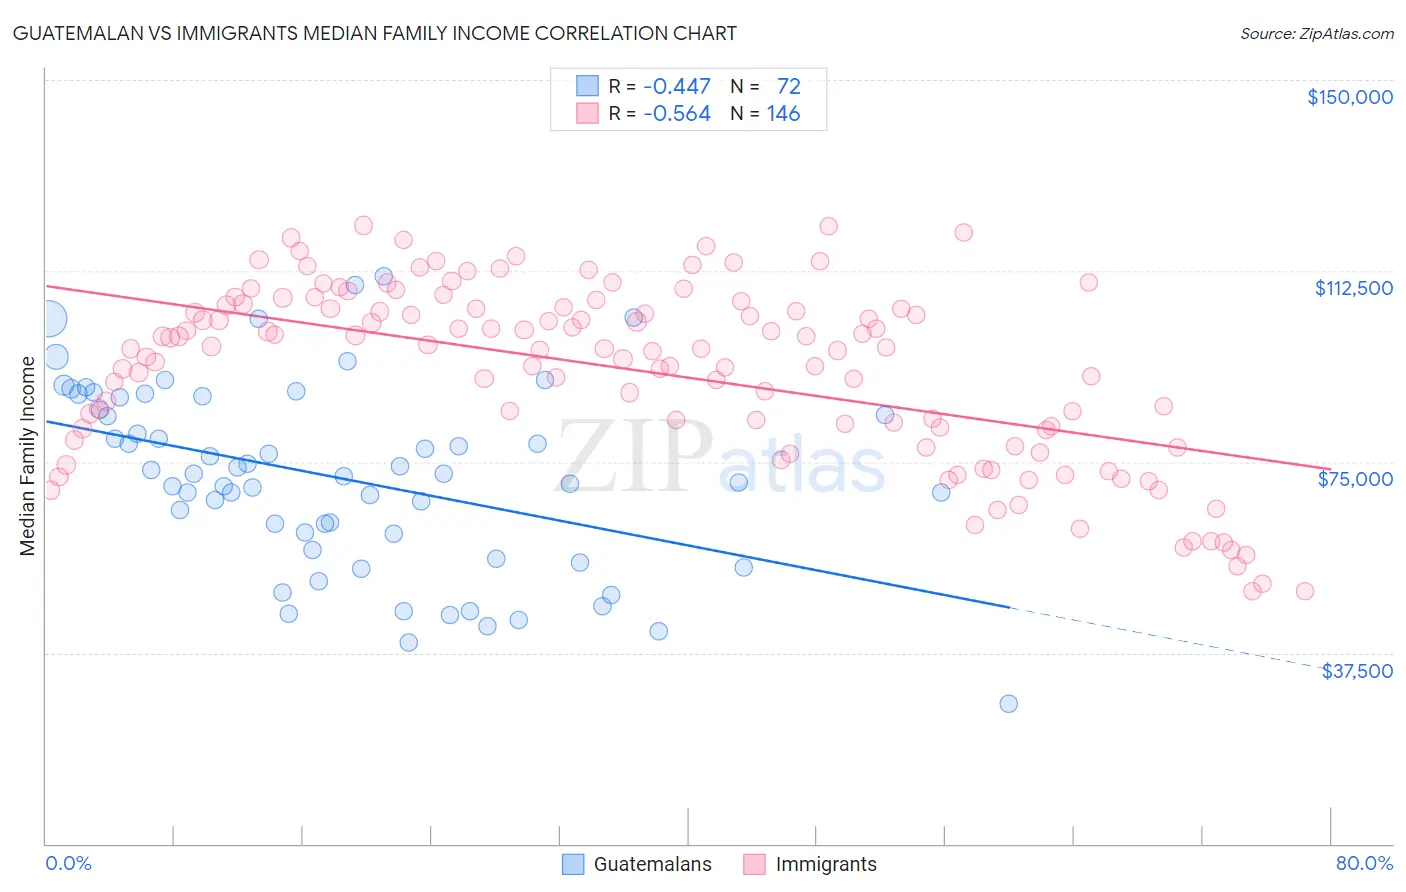
Guatemalan vs Immigrants Median Family Income Correlation Chart
The statistical analysis conducted on geographies consisting of 409,160,818 people shows a moderate negative correlation between the proportion of Guatemalans and median family income in the United States with a correlation coefficient (R) of -0.447 and weighted average of $88,295. Similarly, the statistical analysis conducted on geographies consisting of 575,657,782 people shows a substantial negative correlation between the proportion of Immigrants and median family income in the United States with a correlation coefficient (R) of -0.564 and weighted average of $100,962, a difference of 14.3%.
Median Family Income Correlation Summary
| Measurement | Guatemalan | Immigrants |
| Minimum | $27,406 | $49,547 |
| Maximum | $111,362 | $121,425 |
| Range | $83,956 | $71,878 |
| Mean | $71,713 | $92,890 |
| Median | $72,451 | $97,277 |
| Interquartile 25% (IQ1) | $59,369 | $81,623 |
| Interquartile 75% (IQ3) | $86,431 | $105,367 |
| Interquartile Range (IQR) | $27,062 | $23,744 |
| Standard Deviation (Sample) | $18,247 | $17,448 |
| Standard Deviation (Population) | $18,120 | $17,388 |
Similar Demographics by Median Family Income
Demographics Similar to Guatemalans by Median Family Income
In terms of median family income, the demographic groups most similar to Guatemalans are Indonesian ($88,301, a difference of 0.010%), Immigrants from Nicaragua ($88,267, a difference of 0.030%), Potawatomi ($88,265, a difference of 0.030%), Bangladeshi ($88,358, a difference of 0.070%), and Cherokee ($88,209, a difference of 0.10%).
| Demographics | Rating | Rank | Median Family Income |
| Immigrants | Grenada | 0.1 /100 | #278 | Tragic $89,249 |
| Immigrants | Belize | 0.1 /100 | #279 | Tragic $89,197 |
| British West Indians | 0.1 /100 | #280 | Tragic $88,987 |
| Blackfeet | 0.1 /100 | #281 | Tragic $88,717 |
| Comanche | 0.1 /100 | #282 | Tragic $88,556 |
| Bangladeshis | 0.1 /100 | #283 | Tragic $88,358 |
| Indonesians | 0.1 /100 | #284 | Tragic $88,301 |
| Guatemalans | 0.1 /100 | #285 | Tragic $88,295 |
| Immigrants | Nicaragua | 0.1 /100 | #286 | Tragic $88,267 |
| Potawatomi | 0.1 /100 | #287 | Tragic $88,265 |
| Cherokee | 0.1 /100 | #288 | Tragic $88,209 |
| Central American Indians | 0.1 /100 | #289 | Tragic $88,034 |
| Shoshone | 0.1 /100 | #290 | Tragic $87,872 |
| Immigrants | Cabo Verde | 0.1 /100 | #291 | Tragic $87,830 |
| Africans | 0.1 /100 | #292 | Tragic $87,820 |
Demographics Similar to Immigrants by Median Family Income
In terms of median family income, the demographic groups most similar to Immigrants are Immigrants from Portugal ($100,984, a difference of 0.020%), Guamanian/Chamorro ($101,061, a difference of 0.10%), Tlingit-Haida ($101,092, a difference of 0.13%), Celtic ($101,139, a difference of 0.18%), and Colombian ($100,750, a difference of 0.21%).
| Demographics | Rating | Rank | Median Family Income |
| Kenyans | 34.5 /100 | #183 | Fair $101,417 |
| Immigrants | Costa Rica | 33.7 /100 | #184 | Fair $101,354 |
| Dutch | 31.9 /100 | #185 | Fair $101,192 |
| Celtics | 31.3 /100 | #186 | Fair $101,139 |
| Tlingit-Haida | 30.8 /100 | #187 | Fair $101,092 |
| Guamanians/Chamorros | 30.5 /100 | #188 | Fair $101,061 |
| Immigrants | Portugal | 29.6 /100 | #189 | Fair $100,984 |
| Immigrants | Immigrants | 29.4 /100 | #190 | Fair $100,962 |
| Colombians | 27.2 /100 | #191 | Fair $100,750 |
| Immigrants | Kenya | 26.5 /100 | #192 | Fair $100,679 |
| Iraqis | 26.3 /100 | #193 | Fair $100,658 |
| Uruguayans | 26.3 /100 | #194 | Fair $100,656 |
| Immigrants | South America | 23.9 /100 | #195 | Fair $100,414 |
| Samoans | 23.3 /100 | #196 | Fair $100,344 |
| Immigrants | Cameroon | 22.8 /100 | #197 | Fair $100,289 |