Guatemalan vs Immigrants from Kuwait Median Family Income
COMPARE
Guatemalan
Immigrants from Kuwait
Median Family Income
Median Family Income Comparison
Guatemalans
Immigrants from Kuwait
$88,295
MEDIAN FAMILY INCOME
0.1/ 100
METRIC RATING
285th/ 347
METRIC RANK
$109,731
MEDIAN FAMILY INCOME
97.4/ 100
METRIC RATING
98th/ 347
METRIC RANK
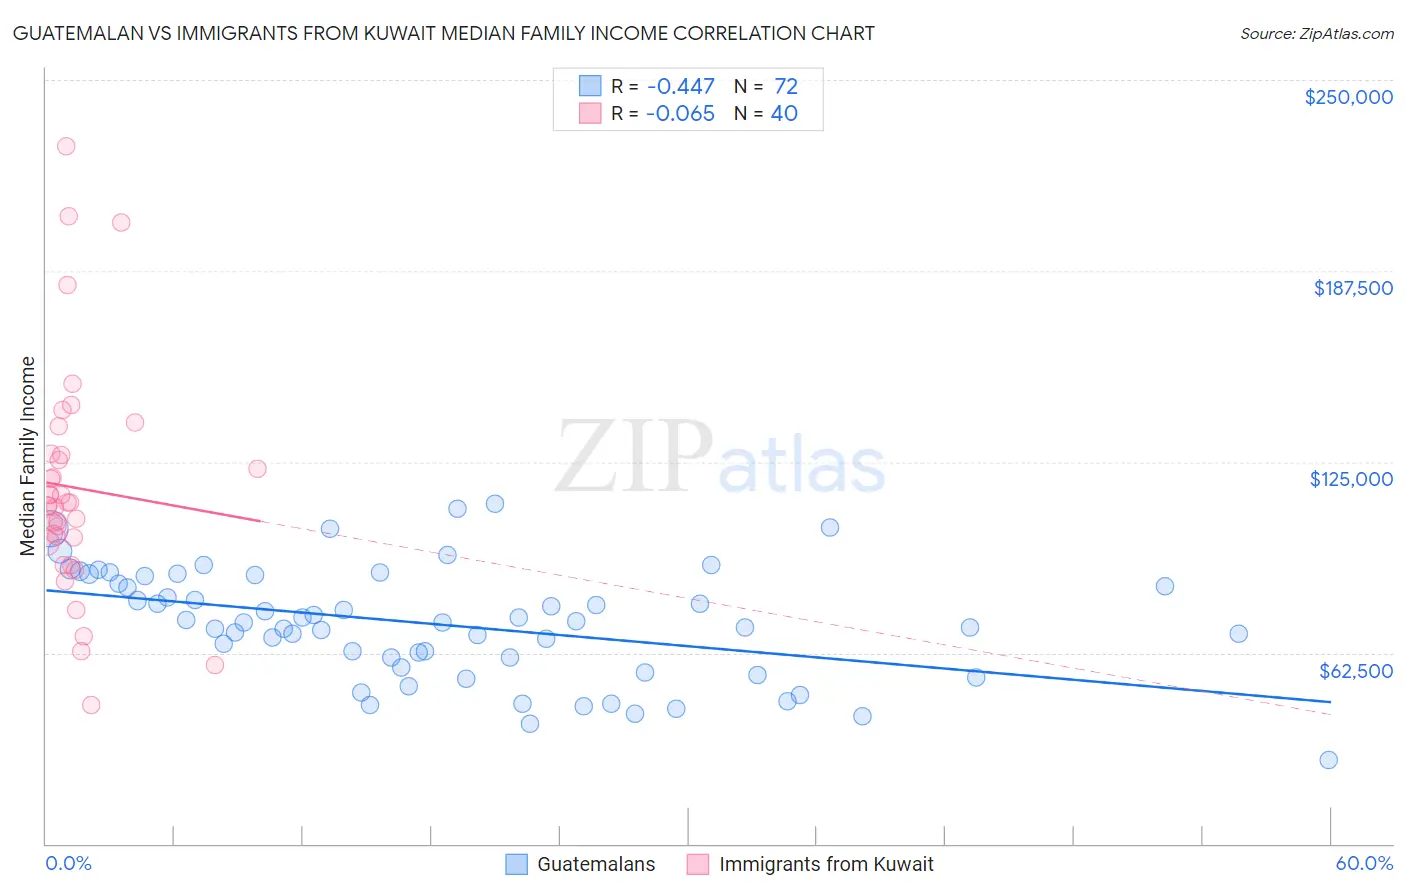
Guatemalan vs Immigrants from Kuwait Median Family Income Correlation Chart
The statistical analysis conducted on geographies consisting of 409,160,818 people shows a moderate negative correlation between the proportion of Guatemalans and median family income in the United States with a correlation coefficient (R) of -0.447 and weighted average of $88,295. Similarly, the statistical analysis conducted on geographies consisting of 136,880,543 people shows a slight negative correlation between the proportion of Immigrants from Kuwait and median family income in the United States with a correlation coefficient (R) of -0.065 and weighted average of $109,731, a difference of 24.3%.
Median Family Income Correlation Summary
| Measurement | Guatemalan | Immigrants from Kuwait |
| Minimum | $27,406 | $45,469 |
| Maximum | $111,362 | $228,438 |
| Range | $83,956 | $182,969 |
| Mean | $71,713 | $116,543 |
| Median | $72,451 | $111,085 |
| Interquartile 25% (IQ1) | $59,369 | $99,414 |
| Interquartile 75% (IQ3) | $86,431 | $127,464 |
| Interquartile Range (IQR) | $27,062 | $28,050 |
| Standard Deviation (Sample) | $18,247 | $37,905 |
| Standard Deviation (Population) | $18,120 | $37,428 |
Similar Demographics by Median Family Income
Demographics Similar to Guatemalans by Median Family Income
In terms of median family income, the demographic groups most similar to Guatemalans are Indonesian ($88,301, a difference of 0.010%), Immigrants from Nicaragua ($88,267, a difference of 0.030%), Potawatomi ($88,265, a difference of 0.030%), Bangladeshi ($88,358, a difference of 0.070%), and Cherokee ($88,209, a difference of 0.10%).
| Demographics | Rating | Rank | Median Family Income |
| Immigrants | Grenada | 0.1 /100 | #278 | Tragic $89,249 |
| Immigrants | Belize | 0.1 /100 | #279 | Tragic $89,197 |
| British West Indians | 0.1 /100 | #280 | Tragic $88,987 |
| Blackfeet | 0.1 /100 | #281 | Tragic $88,717 |
| Comanche | 0.1 /100 | #282 | Tragic $88,556 |
| Bangladeshis | 0.1 /100 | #283 | Tragic $88,358 |
| Indonesians | 0.1 /100 | #284 | Tragic $88,301 |
| Guatemalans | 0.1 /100 | #285 | Tragic $88,295 |
| Immigrants | Nicaragua | 0.1 /100 | #286 | Tragic $88,267 |
| Potawatomi | 0.1 /100 | #287 | Tragic $88,265 |
| Cherokee | 0.1 /100 | #288 | Tragic $88,209 |
| Central American Indians | 0.1 /100 | #289 | Tragic $88,034 |
| Shoshone | 0.1 /100 | #290 | Tragic $87,872 |
| Immigrants | Cabo Verde | 0.1 /100 | #291 | Tragic $87,830 |
| Africans | 0.1 /100 | #292 | Tragic $87,820 |
Demographics Similar to Immigrants from Kuwait by Median Family Income
In terms of median family income, the demographic groups most similar to Immigrants from Kuwait are Armenian ($109,692, a difference of 0.040%), Macedonian ($109,668, a difference of 0.060%), Immigrants from Ukraine ($109,645, a difference of 0.080%), Assyrian/Chaldean/Syriac ($109,622, a difference of 0.10%), and Jordanian ($109,865, a difference of 0.12%).
| Demographics | Rating | Rank | Median Family Income |
| Immigrants | Southern Europe | 98.3 /100 | #91 | Exceptional $110,614 |
| Immigrants | Lebanon | 97.9 /100 | #92 | Exceptional $110,159 |
| Immigrants | Kazakhstan | 97.8 /100 | #93 | Exceptional $110,137 |
| Koreans | 97.8 /100 | #94 | Exceptional $110,103 |
| Zimbabweans | 97.7 /100 | #95 | Exceptional $110,011 |
| Immigrants | Moldova | 97.7 /100 | #96 | Exceptional $109,975 |
| Jordanians | 97.5 /100 | #97 | Exceptional $109,865 |
| Immigrants | Kuwait | 97.4 /100 | #98 | Exceptional $109,731 |
| Armenians | 97.3 /100 | #99 | Exceptional $109,692 |
| Macedonians | 97.3 /100 | #100 | Exceptional $109,668 |
| Immigrants | Ukraine | 97.2 /100 | #101 | Exceptional $109,645 |
| Assyrians/Chaldeans/Syriacs | 97.2 /100 | #102 | Exceptional $109,622 |
| Immigrants | Brazil | 96.9 /100 | #103 | Exceptional $109,418 |
| Palestinians | 96.9 /100 | #104 | Exceptional $109,413 |
| Syrians | 96.7 /100 | #105 | Exceptional $109,299 |