Maltese vs Immigrants from Guatemala Median Family Income
COMPARE
Maltese
Immigrants from Guatemala
Median Family Income
Median Family Income Comparison
Maltese
Immigrants from Guatemala
$115,862
MEDIAN FAMILY INCOME
99.9/ 100
METRIC RATING
52nd/ 347
METRIC RANK
$87,191
MEDIAN FAMILY INCOME
0.0/ 100
METRIC RATING
296th/ 347
METRIC RANK
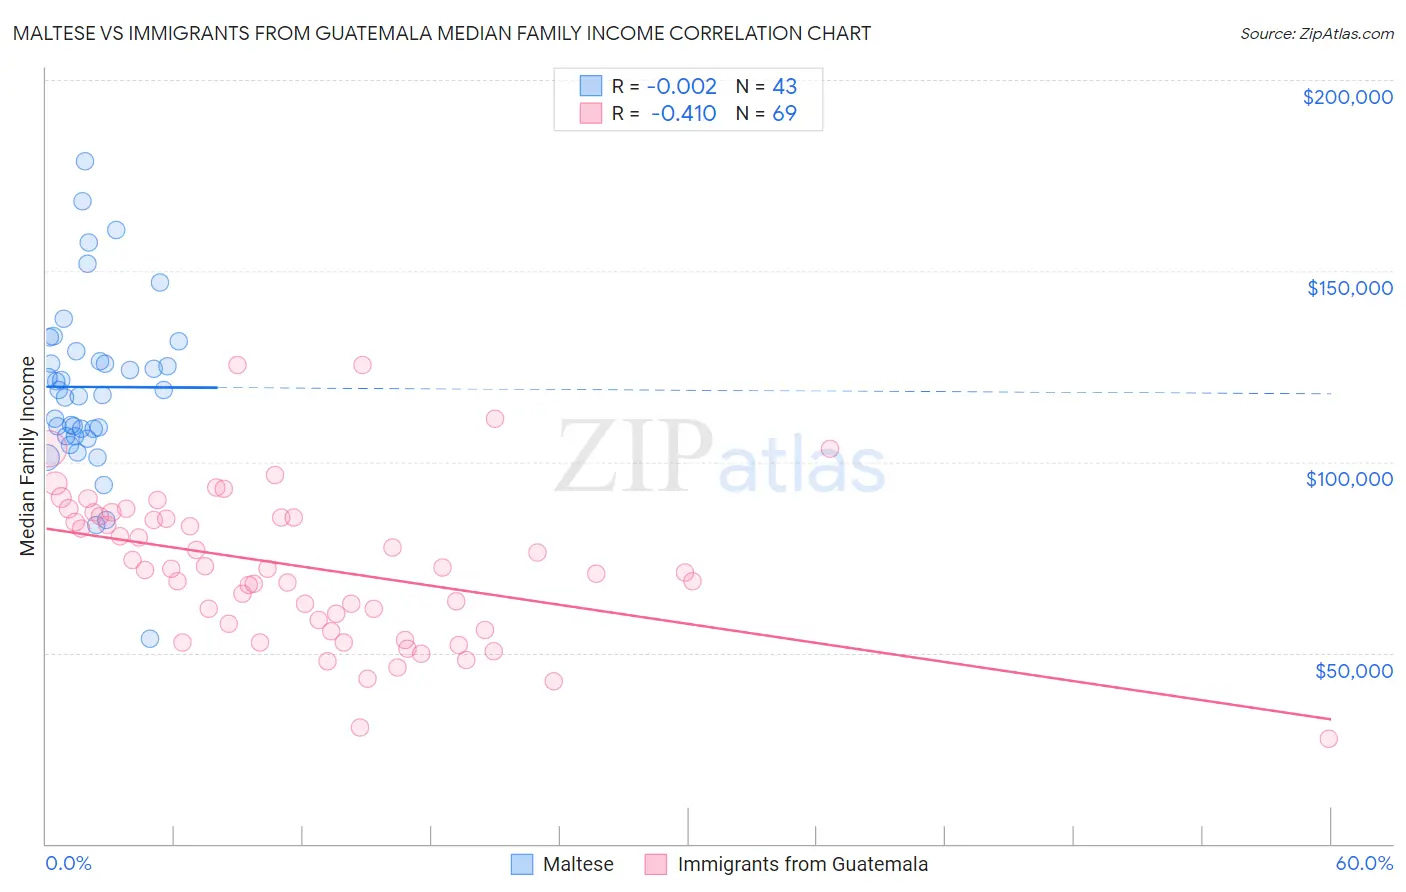
Maltese vs Immigrants from Guatemala Median Family Income Correlation Chart
The statistical analysis conducted on geographies consisting of 126,250,272 people shows no correlation between the proportion of Maltese and median family income in the United States with a correlation coefficient (R) of -0.002 and weighted average of $115,862. Similarly, the statistical analysis conducted on geographies consisting of 377,084,903 people shows a moderate negative correlation between the proportion of Immigrants from Guatemala and median family income in the United States with a correlation coefficient (R) of -0.410 and weighted average of $87,191, a difference of 32.9%.
Median Family Income Correlation Summary
| Measurement | Maltese | Immigrants from Guatemala |
| Minimum | $53,672 | $27,406 |
| Maximum | $178,781 | $125,307 |
| Range | $125,109 | $97,901 |
| Mean | $119,621 | $72,495 |
| Median | $118,717 | $71,855 |
| Interquartile 25% (IQ1) | $106,808 | $56,716 |
| Interquartile 75% (IQ3) | $128,909 | $85,579 |
| Interquartile Range (IQR) | $22,102 | $28,864 |
| Standard Deviation (Sample) | $22,839 | $19,880 |
| Standard Deviation (Population) | $22,571 | $19,735 |
Similar Demographics by Median Family Income
Demographics Similar to Maltese by Median Family Income
In terms of median family income, the demographic groups most similar to Maltese are Immigrants from Malaysia ($115,880, a difference of 0.010%), Immigrants from Norway ($115,847, a difference of 0.010%), Immigrants from Czechoslovakia ($116,165, a difference of 0.26%), Chinese ($116,188, a difference of 0.28%), and Immigrants from Europe ($115,523, a difference of 0.29%).
| Demographics | Rating | Rank | Median Family Income |
| Immigrants | Greece | 99.9 /100 | #45 | Exceptional $117,344 |
| Immigrants | Russia | 99.9 /100 | #46 | Exceptional $116,942 |
| Immigrants | Austria | 99.9 /100 | #47 | Exceptional $116,830 |
| Immigrants | South Africa | 99.9 /100 | #48 | Exceptional $116,286 |
| Chinese | 99.9 /100 | #49 | Exceptional $116,188 |
| Immigrants | Czechoslovakia | 99.9 /100 | #50 | Exceptional $116,165 |
| Immigrants | Malaysia | 99.9 /100 | #51 | Exceptional $115,880 |
| Maltese | 99.9 /100 | #52 | Exceptional $115,862 |
| Immigrants | Norway | 99.9 /100 | #53 | Exceptional $115,847 |
| Immigrants | Europe | 99.9 /100 | #54 | Exceptional $115,523 |
| Lithuanians | 99.8 /100 | #55 | Exceptional $115,395 |
| New Zealanders | 99.8 /100 | #56 | Exceptional $115,230 |
| Greeks | 99.8 /100 | #57 | Exceptional $115,192 |
| Immigrants | Indonesia | 99.8 /100 | #58 | Exceptional $115,162 |
| Immigrants | Netherlands | 99.8 /100 | #59 | Exceptional $114,987 |
Demographics Similar to Immigrants from Guatemala by Median Family Income
In terms of median family income, the demographic groups most similar to Immigrants from Guatemala are Cajun ($87,157, a difference of 0.040%), Yaqui ($87,289, a difference of 0.11%), Fijian ($87,387, a difference of 0.22%), Immigrants from Latin America ($86,989, a difference of 0.23%), and Chippewa ($86,852, a difference of 0.39%).
| Demographics | Rating | Rank | Median Family Income |
| Central American Indians | 0.1 /100 | #289 | Tragic $88,034 |
| Shoshone | 0.1 /100 | #290 | Tragic $87,872 |
| Immigrants | Cabo Verde | 0.1 /100 | #291 | Tragic $87,830 |
| Africans | 0.1 /100 | #292 | Tragic $87,820 |
| Ute | 0.0 /100 | #293 | Tragic $87,596 |
| Fijians | 0.0 /100 | #294 | Tragic $87,387 |
| Yaqui | 0.0 /100 | #295 | Tragic $87,289 |
| Immigrants | Guatemala | 0.0 /100 | #296 | Tragic $87,191 |
| Cajuns | 0.0 /100 | #297 | Tragic $87,157 |
| Immigrants | Latin America | 0.0 /100 | #298 | Tragic $86,989 |
| Chippewa | 0.0 /100 | #299 | Tragic $86,852 |
| Ottawa | 0.0 /100 | #300 | Tragic $86,380 |
| Colville | 0.0 /100 | #301 | Tragic $85,792 |
| Spanish American Indians | 0.0 /100 | #302 | Tragic $85,728 |
| Hispanics or Latinos | 0.0 /100 | #303 | Tragic $85,647 |