Cajun vs Immigrants from Guatemala Median Family Income
COMPARE
Cajun
Immigrants from Guatemala
Median Family Income
Median Family Income Comparison
Cajuns
Immigrants from Guatemala
$87,157
MEDIAN FAMILY INCOME
0.0/ 100
METRIC RATING
297th/ 347
METRIC RANK
$87,191
MEDIAN FAMILY INCOME
0.0/ 100
METRIC RATING
296th/ 347
METRIC RANK
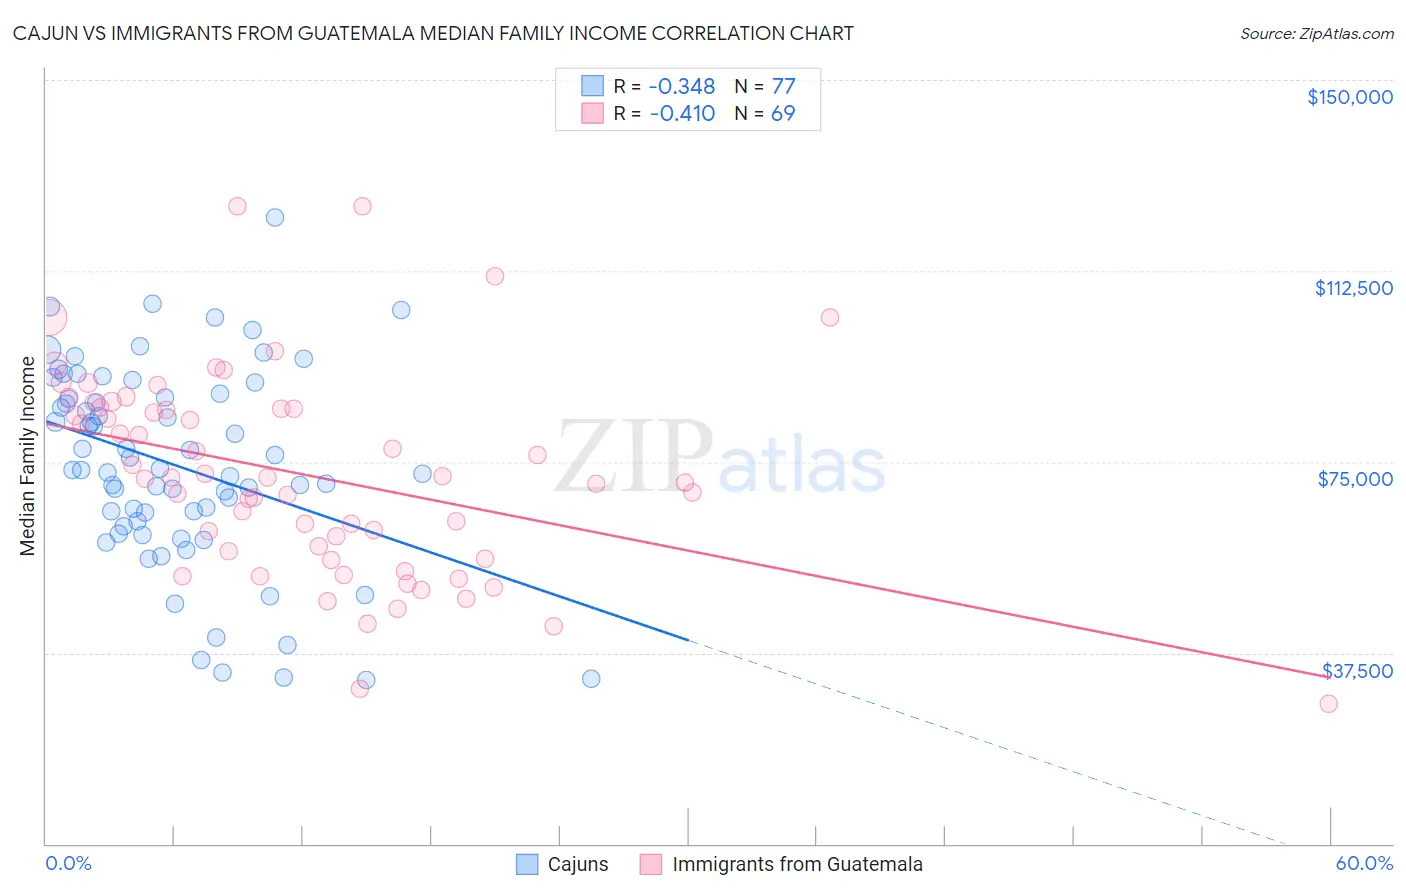
Cajun vs Immigrants from Guatemala Median Family Income Correlation Chart
The statistical analysis conducted on geographies consisting of 149,670,371 people shows a mild negative correlation between the proportion of Cajuns and median family income in the United States with a correlation coefficient (R) of -0.348 and weighted average of $87,157. Similarly, the statistical analysis conducted on geographies consisting of 377,084,903 people shows a moderate negative correlation between the proportion of Immigrants from Guatemala and median family income in the United States with a correlation coefficient (R) of -0.410 and weighted average of $87,191, a difference of 0.040%.
Median Family Income Correlation Summary
| Measurement | Cajun | Immigrants from Guatemala |
| Minimum | $32,222 | $27,406 |
| Maximum | $122,896 | $125,307 |
| Range | $90,674 | $97,901 |
| Mean | $74,286 | $72,495 |
| Median | $73,392 | $71,855 |
| Interquartile 25% (IQ1) | $62,875 | $56,716 |
| Interquartile 75% (IQ3) | $88,056 | $85,579 |
| Interquartile Range (IQR) | $25,181 | $28,864 |
| Standard Deviation (Sample) | $19,414 | $19,880 |
| Standard Deviation (Population) | $19,288 | $19,735 |
Demographics Similar to Cajuns and Immigrants from Guatemala by Median Family Income
In terms of median family income, the demographic groups most similar to Cajuns are Yaqui ($87,289, a difference of 0.15%), Immigrants from Latin America ($86,989, a difference of 0.19%), Fijian ($87,387, a difference of 0.26%), Chippewa ($86,852, a difference of 0.35%), and Ute ($87,596, a difference of 0.50%). Similarly, the demographic groups most similar to Immigrants from Guatemala are Yaqui ($87,289, a difference of 0.11%), Fijian ($87,387, a difference of 0.22%), Immigrants from Latin America ($86,989, a difference of 0.23%), Chippewa ($86,852, a difference of 0.39%), and Ute ($87,596, a difference of 0.46%).
| Demographics | Rating | Rank | Median Family Income |
| Immigrants | Nicaragua | 0.1 /100 | #286 | Tragic $88,267 |
| Potawatomi | 0.1 /100 | #287 | Tragic $88,265 |
| Cherokee | 0.1 /100 | #288 | Tragic $88,209 |
| Central American Indians | 0.1 /100 | #289 | Tragic $88,034 |
| Shoshone | 0.1 /100 | #290 | Tragic $87,872 |
| Immigrants | Cabo Verde | 0.1 /100 | #291 | Tragic $87,830 |
| Africans | 0.1 /100 | #292 | Tragic $87,820 |
| Ute | 0.0 /100 | #293 | Tragic $87,596 |
| Fijians | 0.0 /100 | #294 | Tragic $87,387 |
| Yaqui | 0.0 /100 | #295 | Tragic $87,289 |
| Immigrants | Guatemala | 0.0 /100 | #296 | Tragic $87,191 |
| Cajuns | 0.0 /100 | #297 | Tragic $87,157 |
| Immigrants | Latin America | 0.0 /100 | #298 | Tragic $86,989 |
| Chippewa | 0.0 /100 | #299 | Tragic $86,852 |
| Ottawa | 0.0 /100 | #300 | Tragic $86,380 |
| Colville | 0.0 /100 | #301 | Tragic $85,792 |
| Spanish American Indians | 0.0 /100 | #302 | Tragic $85,728 |
| Hispanics or Latinos | 0.0 /100 | #303 | Tragic $85,647 |
| Mexicans | 0.0 /100 | #304 | Tragic $85,618 |
| Paiute | 0.0 /100 | #305 | Tragic $85,414 |
| Immigrants | Dominica | 0.0 /100 | #306 | Tragic $85,411 |