Choctaw vs Immigrants from Guatemala Median Family Income
COMPARE
Choctaw
Immigrants from Guatemala
Median Family Income
Median Family Income Comparison
Choctaw
Immigrants from Guatemala
$84,835
MEDIAN FAMILY INCOME
0.0/ 100
METRIC RATING
313th/ 347
METRIC RANK
$87,191
MEDIAN FAMILY INCOME
0.0/ 100
METRIC RATING
296th/ 347
METRIC RANK
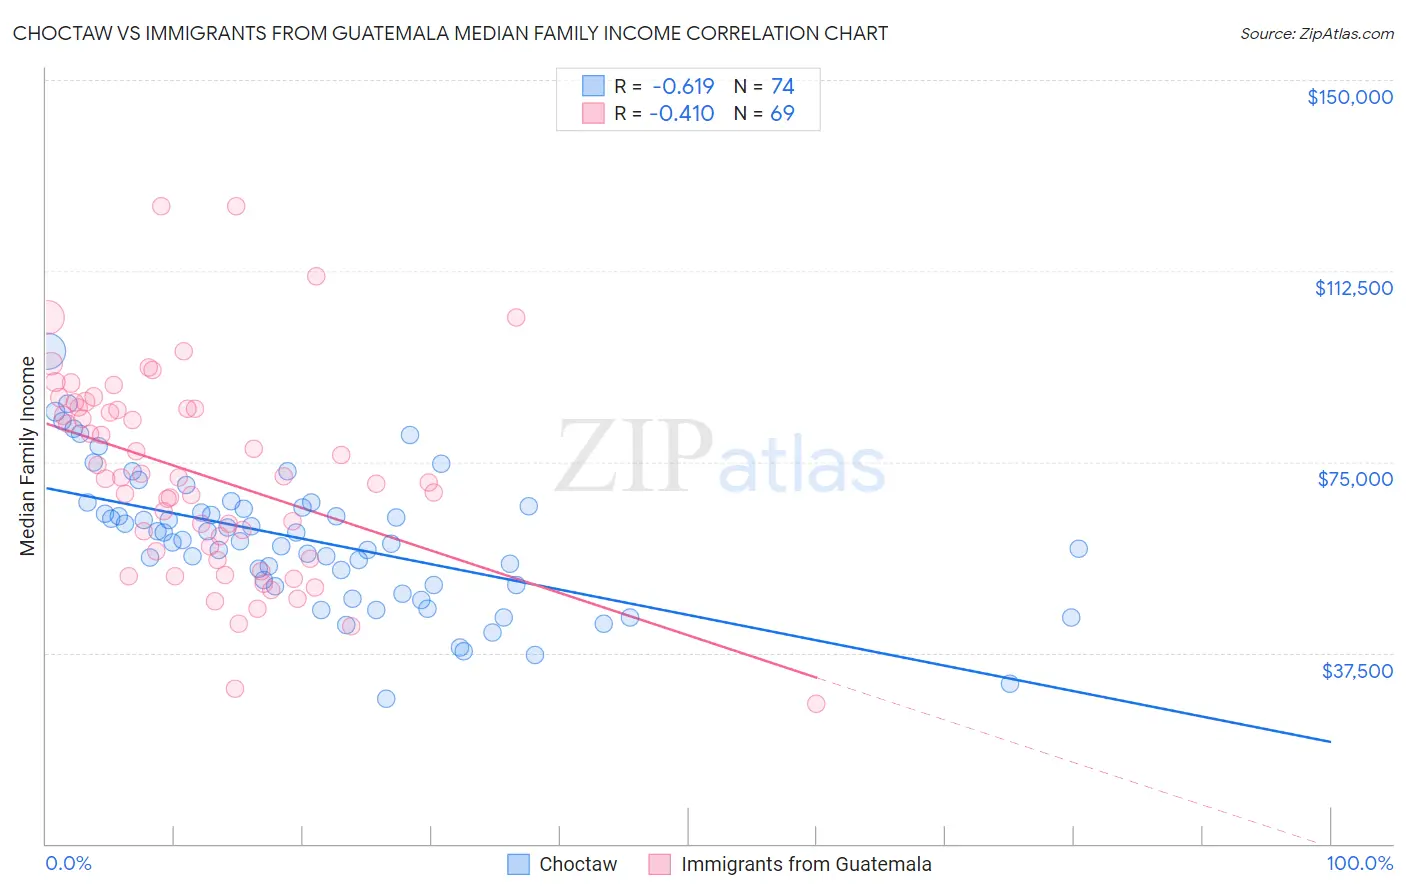
Choctaw vs Immigrants from Guatemala Median Family Income Correlation Chart
The statistical analysis conducted on geographies consisting of 269,558,288 people shows a significant negative correlation between the proportion of Choctaw and median family income in the United States with a correlation coefficient (R) of -0.619 and weighted average of $84,835. Similarly, the statistical analysis conducted on geographies consisting of 377,084,903 people shows a moderate negative correlation between the proportion of Immigrants from Guatemala and median family income in the United States with a correlation coefficient (R) of -0.410 and weighted average of $87,191, a difference of 2.8%.
Median Family Income Correlation Summary
| Measurement | Choctaw | Immigrants from Guatemala |
| Minimum | $28,571 | $27,406 |
| Maximum | $96,727 | $125,307 |
| Range | $68,156 | $97,901 |
| Mean | $59,567 | $72,495 |
| Median | $59,584 | $71,855 |
| Interquartile 25% (IQ1) | $50,833 | $56,716 |
| Interquartile 75% (IQ3) | $66,002 | $85,579 |
| Interquartile Range (IQR) | $15,169 | $28,864 |
| Standard Deviation (Sample) | $13,206 | $19,880 |
| Standard Deviation (Population) | $13,117 | $19,735 |
Demographics Similar to Choctaw and Immigrants from Guatemala by Median Family Income
In terms of median family income, the demographic groups most similar to Choctaw are Immigrants from Bahamas ($84,732, a difference of 0.12%), Cuban ($84,981, a difference of 0.17%), Honduran ($85,004, a difference of 0.20%), Immigrants from Central America ($85,050, a difference of 0.25%), and Haitian ($85,218, a difference of 0.45%). Similarly, the demographic groups most similar to Immigrants from Guatemala are Cajun ($87,157, a difference of 0.040%), Yaqui ($87,289, a difference of 0.11%), Fijian ($87,387, a difference of 0.22%), Immigrants from Latin America ($86,989, a difference of 0.23%), and Chippewa ($86,852, a difference of 0.39%).
| Demographics | Rating | Rank | Median Family Income |
| Fijians | 0.0 /100 | #294 | Tragic $87,387 |
| Yaqui | 0.0 /100 | #295 | Tragic $87,289 |
| Immigrants | Guatemala | 0.0 /100 | #296 | Tragic $87,191 |
| Cajuns | 0.0 /100 | #297 | Tragic $87,157 |
| Immigrants | Latin America | 0.0 /100 | #298 | Tragic $86,989 |
| Chippewa | 0.0 /100 | #299 | Tragic $86,852 |
| Ottawa | 0.0 /100 | #300 | Tragic $86,380 |
| Colville | 0.0 /100 | #301 | Tragic $85,792 |
| Spanish American Indians | 0.0 /100 | #302 | Tragic $85,728 |
| Hispanics or Latinos | 0.0 /100 | #303 | Tragic $85,647 |
| Mexicans | 0.0 /100 | #304 | Tragic $85,618 |
| Paiute | 0.0 /100 | #305 | Tragic $85,414 |
| Immigrants | Dominica | 0.0 /100 | #306 | Tragic $85,411 |
| Chickasaw | 0.0 /100 | #307 | Tragic $85,356 |
| U.S. Virgin Islanders | 0.0 /100 | #308 | Tragic $85,294 |
| Haitians | 0.0 /100 | #309 | Tragic $85,218 |
| Immigrants | Central America | 0.0 /100 | #310 | Tragic $85,050 |
| Hondurans | 0.0 /100 | #311 | Tragic $85,004 |
| Cubans | 0.0 /100 | #312 | Tragic $84,981 |
| Choctaw | 0.0 /100 | #313 | Tragic $84,835 |
| Immigrants | Bahamas | 0.0 /100 | #314 | Tragic $84,732 |