Immigrants from Croatia vs Immigrants from Guatemala Median Family Income
COMPARE
Immigrants from Croatia
Immigrants from Guatemala
Median Family Income
Median Family Income Comparison
Immigrants from Croatia
Immigrants from Guatemala
$112,323
MEDIAN FAMILY INCOME
99.3/ 100
METRIC RATING
80th/ 347
METRIC RANK
$87,191
MEDIAN FAMILY INCOME
0.0/ 100
METRIC RATING
296th/ 347
METRIC RANK
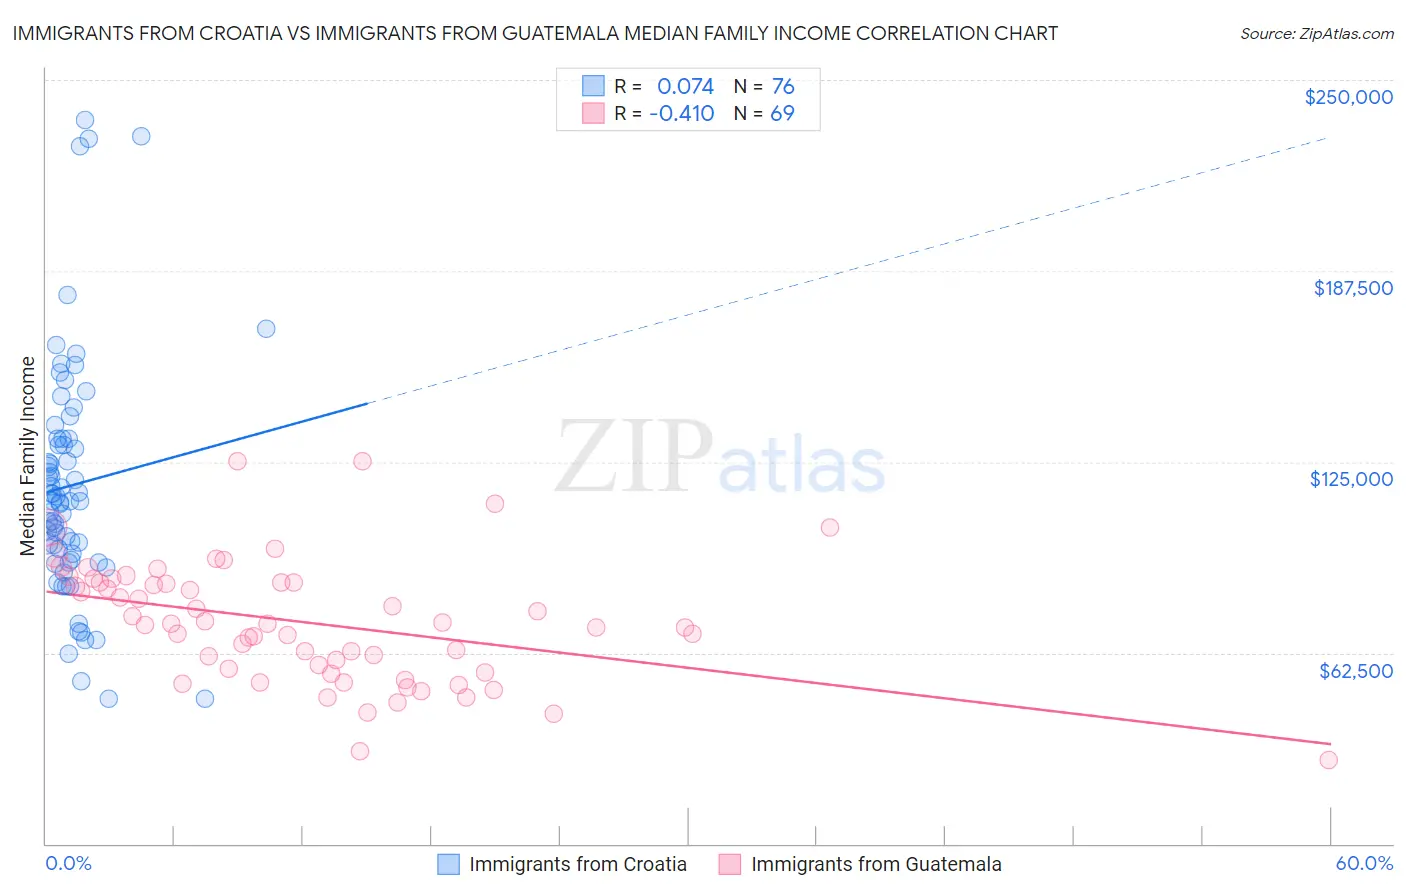
Immigrants from Croatia vs Immigrants from Guatemala Median Family Income Correlation Chart
The statistical analysis conducted on geographies consisting of 132,566,402 people shows a slight positive correlation between the proportion of Immigrants from Croatia and median family income in the United States with a correlation coefficient (R) of 0.074 and weighted average of $112,323. Similarly, the statistical analysis conducted on geographies consisting of 377,084,903 people shows a moderate negative correlation between the proportion of Immigrants from Guatemala and median family income in the United States with a correlation coefficient (R) of -0.410 and weighted average of $87,191, a difference of 28.8%.
Median Family Income Correlation Summary
| Measurement | Immigrants from Croatia | Immigrants from Guatemala |
| Minimum | $47,321 | $27,406 |
| Maximum | $236,888 | $125,307 |
| Range | $189,567 | $97,901 |
| Mean | $117,325 | $72,495 |
| Median | $112,019 | $71,855 |
| Interquartile 25% (IQ1) | $93,889 | $56,716 |
| Interquartile 75% (IQ3) | $132,485 | $85,579 |
| Interquartile Range (IQR) | $38,596 | $28,864 |
| Standard Deviation (Sample) | $39,118 | $19,880 |
| Standard Deviation (Population) | $38,860 | $19,735 |
Similar Demographics by Median Family Income
Demographics Similar to Immigrants from Croatia by Median Family Income
In terms of median family income, the demographic groups most similar to Immigrants from Croatia are Italian ($112,372, a difference of 0.040%), Immigrants from Canada ($112,374, a difference of 0.050%), Immigrants from North America ($112,151, a difference of 0.15%), Immigrants from Eastern Europe ($112,527, a difference of 0.18%), and Immigrants from England ($112,038, a difference of 0.25%).
| Demographics | Rating | Rank | Median Family Income |
| Laotians | 99.5 /100 | #73 | Exceptional $112,859 |
| Immigrants | Italy | 99.4 /100 | #74 | Exceptional $112,848 |
| Immigrants | Western Europe | 99.4 /100 | #75 | Exceptional $112,688 |
| Argentineans | 99.4 /100 | #76 | Exceptional $112,665 |
| Immigrants | Eastern Europe | 99.4 /100 | #77 | Exceptional $112,527 |
| Immigrants | Canada | 99.3 /100 | #78 | Exceptional $112,374 |
| Italians | 99.3 /100 | #79 | Exceptional $112,372 |
| Immigrants | Croatia | 99.3 /100 | #80 | Exceptional $112,323 |
| Immigrants | North America | 99.2 /100 | #81 | Exceptional $112,151 |
| Immigrants | England | 99.2 /100 | #82 | Exceptional $112,038 |
| Immigrants | Egypt | 99.0 /100 | #83 | Exceptional $111,689 |
| Immigrants | Hungary | 98.8 /100 | #84 | Exceptional $111,378 |
| Croatians | 98.8 /100 | #85 | Exceptional $111,370 |
| Ukrainians | 98.8 /100 | #86 | Exceptional $111,368 |
| Austrians | 98.8 /100 | #87 | Exceptional $111,306 |
Demographics Similar to Immigrants from Guatemala by Median Family Income
In terms of median family income, the demographic groups most similar to Immigrants from Guatemala are Cajun ($87,157, a difference of 0.040%), Yaqui ($87,289, a difference of 0.11%), Fijian ($87,387, a difference of 0.22%), Immigrants from Latin America ($86,989, a difference of 0.23%), and Chippewa ($86,852, a difference of 0.39%).
| Demographics | Rating | Rank | Median Family Income |
| Central American Indians | 0.1 /100 | #289 | Tragic $88,034 |
| Shoshone | 0.1 /100 | #290 | Tragic $87,872 |
| Immigrants | Cabo Verde | 0.1 /100 | #291 | Tragic $87,830 |
| Africans | 0.1 /100 | #292 | Tragic $87,820 |
| Ute | 0.0 /100 | #293 | Tragic $87,596 |
| Fijians | 0.0 /100 | #294 | Tragic $87,387 |
| Yaqui | 0.0 /100 | #295 | Tragic $87,289 |
| Immigrants | Guatemala | 0.0 /100 | #296 | Tragic $87,191 |
| Cajuns | 0.0 /100 | #297 | Tragic $87,157 |
| Immigrants | Latin America | 0.0 /100 | #298 | Tragic $86,989 |
| Chippewa | 0.0 /100 | #299 | Tragic $86,852 |
| Ottawa | 0.0 /100 | #300 | Tragic $86,380 |
| Colville | 0.0 /100 | #301 | Tragic $85,792 |
| Spanish American Indians | 0.0 /100 | #302 | Tragic $85,728 |
| Hispanics or Latinos | 0.0 /100 | #303 | Tragic $85,647 |