Israeli vs Eastern European Median Family Income
COMPARE
Israeli
Eastern European
Median Family Income
Median Family Income Comparison
Israelis
Eastern Europeans
$118,577
MEDIAN FAMILY INCOME
100.0/ 100
METRIC RATING
36th/ 347
METRIC RANK
$125,546
MEDIAN FAMILY INCOME
100.0/ 100
METRIC RATING
15th/ 347
METRIC RANK
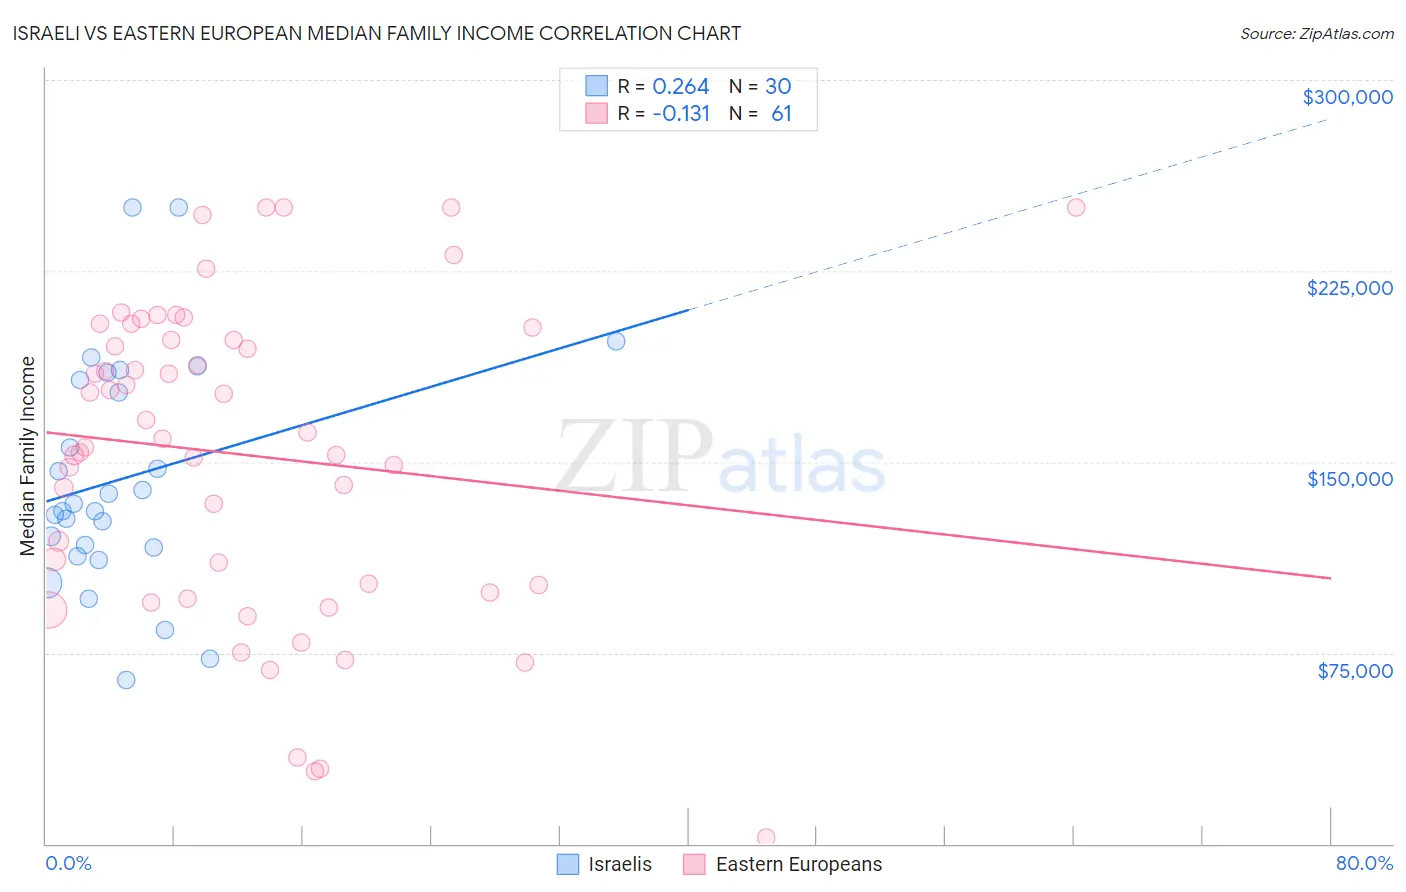
Israeli vs Eastern European Median Family Income Correlation Chart
The statistical analysis conducted on geographies consisting of 210,932,899 people shows a weak positive correlation between the proportion of Israelis and median family income in the United States with a correlation coefficient (R) of 0.264 and weighted average of $118,577. Similarly, the statistical analysis conducted on geographies consisting of 460,782,256 people shows a poor negative correlation between the proportion of Eastern Europeans and median family income in the United States with a correlation coefficient (R) of -0.131 and weighted average of $125,546, a difference of 5.9%.
Median Family Income Correlation Summary
| Measurement | Israeli | Eastern European |
| Minimum | $64,441 | $2,499 |
| Maximum | $250,001 | $250,001 |
| Range | $185,560 | $247,502 |
| Mean | $143,645 | $152,671 |
| Median | $132,084 | $158,974 |
| Interquartile 25% (IQ1) | $116,332 | $100,360 |
| Interquartile 75% (IQ3) | $182,189 | $200,154 |
| Interquartile Range (IQR) | $65,857 | $99,794 |
| Standard Deviation (Sample) | $45,469 | $61,552 |
| Standard Deviation (Population) | $44,705 | $61,045 |
Similar Demographics by Median Family Income
Demographics Similar to Israelis by Median Family Income
In terms of median family income, the demographic groups most similar to Israelis are Australian ($118,440, a difference of 0.12%), Immigrants from Turkey ($118,325, a difference of 0.21%), Immigrants from Asia ($118,291, a difference of 0.24%), Immigrants from Lithuania ($118,053, a difference of 0.44%), and Estonian ($118,013, a difference of 0.48%).
| Demographics | Rating | Rank | Median Family Income |
| Latvians | 100.0 /100 | #29 | Exceptional $120,301 |
| Immigrants | Sri Lanka | 100.0 /100 | #30 | Exceptional $120,263 |
| Immigrants | France | 100.0 /100 | #31 | Exceptional $120,076 |
| Asians | 100.0 /100 | #32 | Exceptional $119,955 |
| Bhutanese | 100.0 /100 | #33 | Exceptional $119,800 |
| Bolivians | 100.0 /100 | #34 | Exceptional $119,479 |
| Soviet Union | 100.0 /100 | #35 | Exceptional $119,262 |
| Israelis | 100.0 /100 | #36 | Exceptional $118,577 |
| Australians | 100.0 /100 | #37 | Exceptional $118,440 |
| Immigrants | Turkey | 100.0 /100 | #38 | Exceptional $118,325 |
| Immigrants | Asia | 100.0 /100 | #39 | Exceptional $118,291 |
| Immigrants | Lithuania | 100.0 /100 | #40 | Exceptional $118,053 |
| Estonians | 100.0 /100 | #41 | Exceptional $118,013 |
| Immigrants | Bolivia | 100.0 /100 | #42 | Exceptional $117,912 |
| Bulgarians | 100.0 /100 | #43 | Exceptional $117,818 |
Demographics Similar to Eastern Europeans by Median Family Income
In terms of median family income, the demographic groups most similar to Eastern Europeans are Immigrants from China ($125,540, a difference of 0.0%), Indian (Asian) ($125,312, a difference of 0.19%), Immigrants from Eastern Asia ($125,150, a difference of 0.32%), Immigrants from South Central Asia ($125,956, a difference of 0.33%), and Immigrants from Australia ($126,620, a difference of 0.86%).
| Demographics | Rating | Rank | Median Family Income |
| Immigrants | Iran | 100.0 /100 | #8 | Exceptional $130,894 |
| Okinawans | 100.0 /100 | #9 | Exceptional $129,979 |
| Immigrants | Ireland | 100.0 /100 | #10 | Exceptional $127,584 |
| Immigrants | Israel | 100.0 /100 | #11 | Exceptional $127,430 |
| Cypriots | 100.0 /100 | #12 | Exceptional $127,064 |
| Immigrants | Australia | 100.0 /100 | #13 | Exceptional $126,620 |
| Immigrants | South Central Asia | 100.0 /100 | #14 | Exceptional $125,956 |
| Eastern Europeans | 100.0 /100 | #15 | Exceptional $125,546 |
| Immigrants | China | 100.0 /100 | #16 | Exceptional $125,540 |
| Indians (Asian) | 100.0 /100 | #17 | Exceptional $125,312 |
| Immigrants | Eastern Asia | 100.0 /100 | #18 | Exceptional $125,150 |
| Immigrants | Belgium | 100.0 /100 | #19 | Exceptional $123,831 |
| Burmese | 100.0 /100 | #20 | Exceptional $123,369 |
| Immigrants | Korea | 100.0 /100 | #21 | Exceptional $122,800 |
| Immigrants | Sweden | 100.0 /100 | #22 | Exceptional $122,765 |