Taiwanese vs Eastern European Median Family Income
COMPARE
Taiwanese
Eastern European
Median Family Income
Median Family Income Comparison
Taiwanese
Eastern Europeans
$107,295
MEDIAN FAMILY INCOME
91.4/ 100
METRIC RATING
125th/ 347
METRIC RANK
$125,546
MEDIAN FAMILY INCOME
100.0/ 100
METRIC RATING
15th/ 347
METRIC RANK
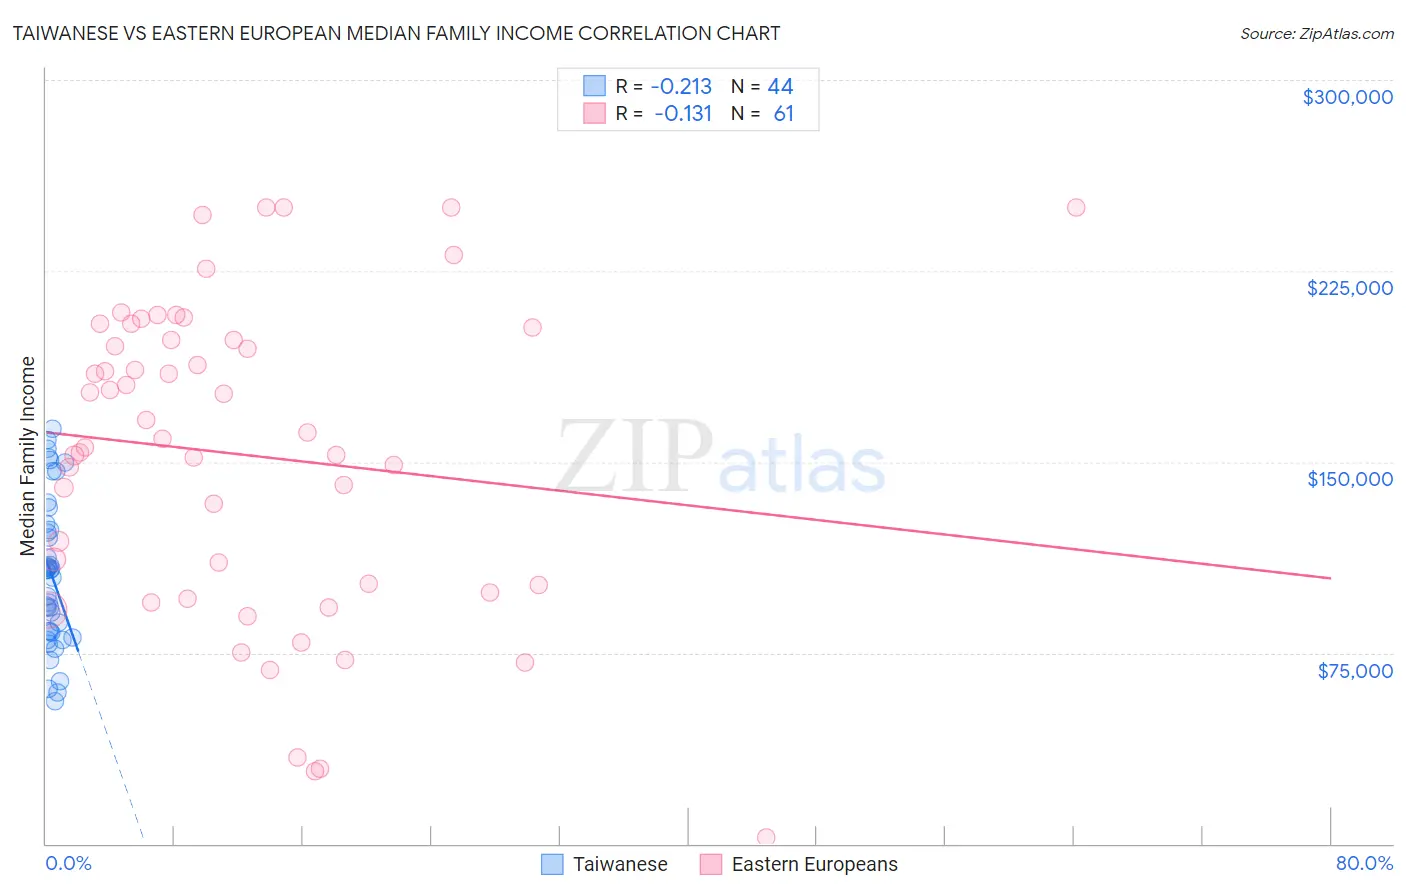
Taiwanese vs Eastern European Median Family Income Correlation Chart
The statistical analysis conducted on geographies consisting of 31,709,765 people shows a weak negative correlation between the proportion of Taiwanese and median family income in the United States with a correlation coefficient (R) of -0.213 and weighted average of $107,295. Similarly, the statistical analysis conducted on geographies consisting of 460,782,256 people shows a poor negative correlation between the proportion of Eastern Europeans and median family income in the United States with a correlation coefficient (R) of -0.131 and weighted average of $125,546, a difference of 17.0%.
Median Family Income Correlation Summary
| Measurement | Taiwanese | Eastern European |
| Minimum | $56,146 | $2,499 |
| Maximum | $162,974 | $250,001 |
| Range | $106,828 | $247,502 |
| Mean | $106,094 | $152,671 |
| Median | $107,372 | $158,974 |
| Interquartile 25% (IQ1) | $83,038 | $100,360 |
| Interquartile 75% (IQ3) | $124,300 | $200,154 |
| Interquartile Range (IQR) | $41,262 | $99,794 |
| Standard Deviation (Sample) | $29,129 | $61,552 |
| Standard Deviation (Population) | $28,796 | $61,045 |
Similar Demographics by Median Family Income
Demographics Similar to Taiwanese by Median Family Income
In terms of median family income, the demographic groups most similar to Taiwanese are Pakistani ($107,390, a difference of 0.090%), Serbian ($107,157, a difference of 0.13%), Carpatho Rusyn ($107,502, a difference of 0.19%), Lebanese ($107,086, a difference of 0.19%), and Immigrants from Ethiopia ($106,969, a difference of 0.30%).
| Demographics | Rating | Rank | Median Family Income |
| Ethiopians | 94.5 /100 | #118 | Exceptional $108,251 |
| Sri Lankans | 94.5 /100 | #119 | Exceptional $108,234 |
| Immigrants | Northern Africa | 94.3 /100 | #120 | Exceptional $108,161 |
| Europeans | 94.1 /100 | #121 | Exceptional $108,099 |
| Immigrants | Jordan | 92.9 /100 | #122 | Exceptional $107,715 |
| Carpatho Rusyns | 92.2 /100 | #123 | Exceptional $107,502 |
| Pakistanis | 91.7 /100 | #124 | Exceptional $107,390 |
| Taiwanese | 91.4 /100 | #125 | Exceptional $107,295 |
| Serbians | 90.8 /100 | #126 | Exceptional $107,157 |
| Lebanese | 90.5 /100 | #127 | Exceptional $107,086 |
| Immigrants | Ethiopia | 90.0 /100 | #128 | Excellent $106,969 |
| Arabs | 89.9 /100 | #129 | Excellent $106,952 |
| Brazilians | 89.8 /100 | #130 | Excellent $106,942 |
| Canadians | 88.1 /100 | #131 | Excellent $106,597 |
| Immigrants | Fiji | 87.8 /100 | #132 | Excellent $106,544 |
Demographics Similar to Eastern Europeans by Median Family Income
In terms of median family income, the demographic groups most similar to Eastern Europeans are Immigrants from China ($125,540, a difference of 0.0%), Indian (Asian) ($125,312, a difference of 0.19%), Immigrants from Eastern Asia ($125,150, a difference of 0.32%), Immigrants from South Central Asia ($125,956, a difference of 0.33%), and Immigrants from Australia ($126,620, a difference of 0.86%).
| Demographics | Rating | Rank | Median Family Income |
| Immigrants | Iran | 100.0 /100 | #8 | Exceptional $130,894 |
| Okinawans | 100.0 /100 | #9 | Exceptional $129,979 |
| Immigrants | Ireland | 100.0 /100 | #10 | Exceptional $127,584 |
| Immigrants | Israel | 100.0 /100 | #11 | Exceptional $127,430 |
| Cypriots | 100.0 /100 | #12 | Exceptional $127,064 |
| Immigrants | Australia | 100.0 /100 | #13 | Exceptional $126,620 |
| Immigrants | South Central Asia | 100.0 /100 | #14 | Exceptional $125,956 |
| Eastern Europeans | 100.0 /100 | #15 | Exceptional $125,546 |
| Immigrants | China | 100.0 /100 | #16 | Exceptional $125,540 |
| Indians (Asian) | 100.0 /100 | #17 | Exceptional $125,312 |
| Immigrants | Eastern Asia | 100.0 /100 | #18 | Exceptional $125,150 |
| Immigrants | Belgium | 100.0 /100 | #19 | Exceptional $123,831 |
| Burmese | 100.0 /100 | #20 | Exceptional $123,369 |
| Immigrants | Korea | 100.0 /100 | #21 | Exceptional $122,800 |
| Immigrants | Sweden | 100.0 /100 | #22 | Exceptional $122,765 |