Guamanian/Chamorro vs Bangladeshi Single Mother Households
COMPARE
Guamanian/Chamorro
Bangladeshi
Single Mother Households
Single Mother Households Comparison
Guamanians/Chamorros
Bangladeshis
6.6%
SINGLE MOTHER HOUSEHOLDS
12.4/ 100
METRIC RATING
202nd/ 347
METRIC RANK
8.1%
SINGLE MOTHER HOUSEHOLDS
0.0/ 100
METRIC RATING
312th/ 347
METRIC RANK
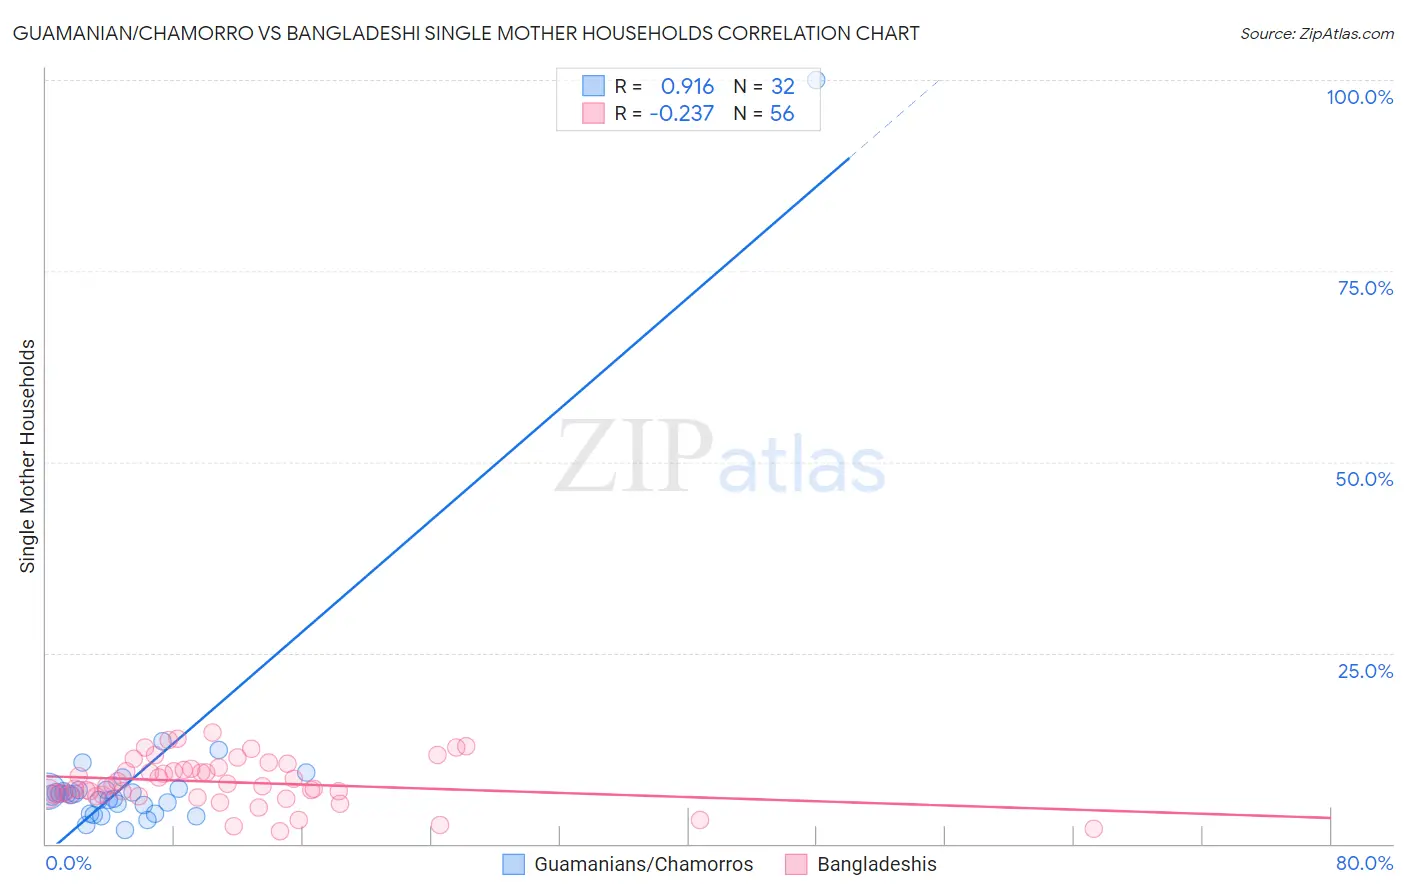
Guamanian/Chamorro vs Bangladeshi Single Mother Households Correlation Chart
The statistical analysis conducted on geographies consisting of 221,648,092 people shows a near-perfect positive correlation between the proportion of Guamanians/Chamorros and percentage of single mother households in the United States with a correlation coefficient (R) of 0.916 and weighted average of 6.6%. Similarly, the statistical analysis conducted on geographies consisting of 141,271,331 people shows a weak negative correlation between the proportion of Bangladeshis and percentage of single mother households in the United States with a correlation coefficient (R) of -0.237 and weighted average of 8.1%, a difference of 22.4%.
Single Mother Households Correlation Summary
| Measurement | Guamanian/Chamorro | Bangladeshi |
| Minimum | 1.8% | 1.7% |
| Maximum | 100.0% | 14.6% |
| Range | 98.2% | 13.0% |
| Mean | 9.2% | 8.1% |
| Median | 6.4% | 7.6% |
| Interquartile 25% (IQ1) | 4.5% | 6.4% |
| Interquartile 75% (IQ3) | 7.1% | 9.9% |
| Interquartile Range (IQR) | 2.5% | 3.5% |
| Standard Deviation (Sample) | 16.8% | 3.1% |
| Standard Deviation (Population) | 16.5% | 3.1% |
Similar Demographics by Single Mother Households
Demographics Similar to Guamanians/Chamorros by Single Mother Households
In terms of single mother households, the demographic groups most similar to Guamanians/Chamorros are Immigrants from Peru (6.7%, a difference of 0.090%), Immigrants from Fiji (6.7%, a difference of 0.11%), Venezuelan (6.6%, a difference of 0.12%), Cree (6.7%, a difference of 0.13%), and German Russian (6.7%, a difference of 0.21%).
| Demographics | Rating | Rank | Single Mother Households |
| South Americans | 18.0 /100 | #195 | Poor 6.6% |
| Uruguayans | 18.0 /100 | #196 | Poor 6.6% |
| Moroccans | 17.4 /100 | #197 | Poor 6.6% |
| Hawaiians | 16.1 /100 | #198 | Poor 6.6% |
| Potawatomi | 15.5 /100 | #199 | Poor 6.6% |
| Immigrants | Ethiopia | 14.7 /100 | #200 | Poor 6.6% |
| Venezuelans | 12.9 /100 | #201 | Poor 6.6% |
| Guamanians/Chamorros | 12.4 /100 | #202 | Poor 6.6% |
| Immigrants | Peru | 12.0 /100 | #203 | Poor 6.7% |
| Immigrants | Fiji | 11.9 /100 | #204 | Poor 6.7% |
| Cree | 11.9 /100 | #205 | Poor 6.7% |
| German Russians | 11.5 /100 | #206 | Poor 6.7% |
| Immigrants | South America | 11.5 /100 | #207 | Poor 6.7% |
| Vietnamese | 11.3 /100 | #208 | Poor 6.7% |
| Immigrants | Colombia | 10.5 /100 | #209 | Poor 6.7% |
Demographics Similar to Bangladeshis by Single Mother Households
In terms of single mother households, the demographic groups most similar to Bangladeshis are Immigrants from Grenada (8.2%, a difference of 0.16%), Immigrants from Mexico (8.2%, a difference of 0.28%), Immigrants from Congo (8.1%, a difference of 0.29%), Immigrants from Western Africa (8.2%, a difference of 0.31%), and African (8.2%, a difference of 0.46%).
| Demographics | Rating | Rank | Single Mother Households |
| Colville | 0.0 /100 | #305 | Tragic 8.0% |
| Immigrants | Barbados | 0.0 /100 | #306 | Tragic 8.0% |
| Immigrants | St. Vincent and the Grenadines | 0.0 /100 | #307 | Tragic 8.0% |
| Immigrants | Central America | 0.0 /100 | #308 | Tragic 8.1% |
| Cheyenne | 0.0 /100 | #309 | Tragic 8.1% |
| Hondurans | 0.0 /100 | #310 | Tragic 8.1% |
| Immigrants | Congo | 0.0 /100 | #311 | Tragic 8.1% |
| Bangladeshis | 0.0 /100 | #312 | Tragic 8.1% |
| Immigrants | Grenada | 0.0 /100 | #313 | Tragic 8.2% |
| Immigrants | Mexico | 0.0 /100 | #314 | Tragic 8.2% |
| Immigrants | Western Africa | 0.0 /100 | #315 | Tragic 8.2% |
| Africans | 0.0 /100 | #316 | Tragic 8.2% |
| Immigrants | Honduras | 0.0 /100 | #317 | Tragic 8.2% |
| Senegalese | 0.0 /100 | #318 | Tragic 8.2% |
| Jamaicans | 0.0 /100 | #319 | Tragic 8.2% |