Immigrants from South Central Asia vs Bangladeshi Median Family Income
COMPARE
Immigrants from South Central Asia
Bangladeshi
Median Family Income
Median Family Income Comparison
Immigrants from South Central Asia
Bangladeshis
$125,956
MEDIAN FAMILY INCOME
100.0/ 100
METRIC RATING
14th/ 347
METRIC RANK
$88,358
MEDIAN FAMILY INCOME
0.1/ 100
METRIC RATING
283rd/ 347
METRIC RANK
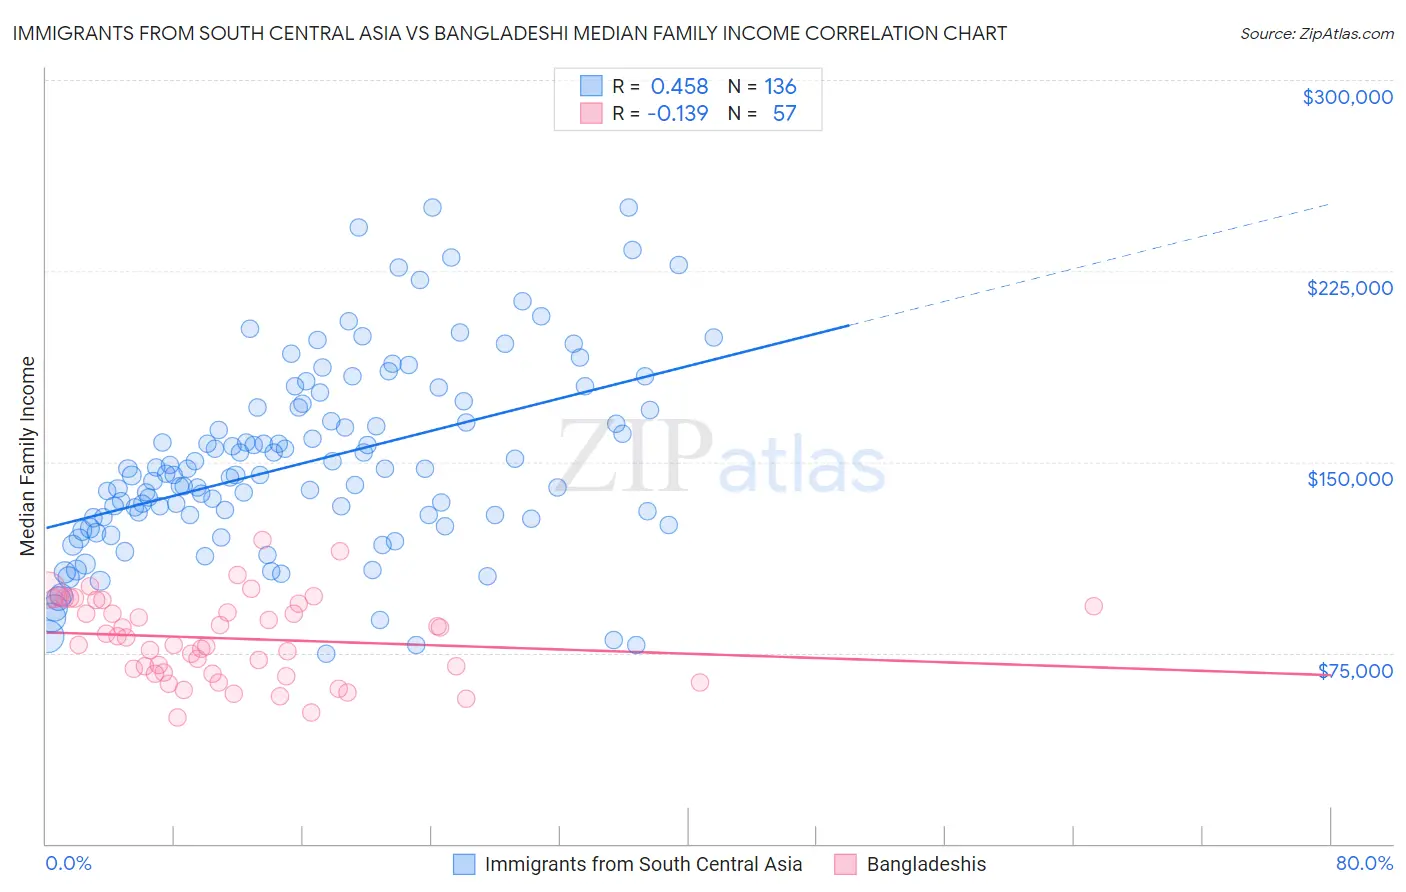
Immigrants from South Central Asia vs Bangladeshi Median Family Income Correlation Chart
The statistical analysis conducted on geographies consisting of 472,438,765 people shows a moderate positive correlation between the proportion of Immigrants from South Central Asia and median family income in the United States with a correlation coefficient (R) of 0.458 and weighted average of $125,956. Similarly, the statistical analysis conducted on geographies consisting of 141,321,089 people shows a poor negative correlation between the proportion of Bangladeshis and median family income in the United States with a correlation coefficient (R) of -0.139 and weighted average of $88,358, a difference of 42.5%.
Median Family Income Correlation Summary
| Measurement | Immigrants from South Central Asia | Bangladeshi |
| Minimum | $74,415 | $49,670 |
| Maximum | $250,001 | $119,471 |
| Range | $175,586 | $69,801 |
| Mean | $149,714 | $80,654 |
| Median | $145,025 | $81,226 |
| Interquartile 25% (IQ1) | $127,772 | $67,095 |
| Interquartile 75% (IQ3) | $171,402 | $94,926 |
| Interquartile Range (IQR) | $43,630 | $27,831 |
| Standard Deviation (Sample) | $37,158 | $16,058 |
| Standard Deviation (Population) | $37,021 | $15,916 |
Similar Demographics by Median Family Income
Demographics Similar to Immigrants from South Central Asia by Median Family Income
In terms of median family income, the demographic groups most similar to Immigrants from South Central Asia are Eastern European ($125,546, a difference of 0.33%), Immigrants from China ($125,540, a difference of 0.33%), Indian (Asian) ($125,312, a difference of 0.51%), Immigrants from Australia ($126,620, a difference of 0.53%), and Immigrants from Eastern Asia ($125,150, a difference of 0.64%).
| Demographics | Rating | Rank | Median Family Income |
| Immigrants | Hong Kong | 100.0 /100 | #7 | Exceptional $131,067 |
| Immigrants | Iran | 100.0 /100 | #8 | Exceptional $130,894 |
| Okinawans | 100.0 /100 | #9 | Exceptional $129,979 |
| Immigrants | Ireland | 100.0 /100 | #10 | Exceptional $127,584 |
| Immigrants | Israel | 100.0 /100 | #11 | Exceptional $127,430 |
| Cypriots | 100.0 /100 | #12 | Exceptional $127,064 |
| Immigrants | Australia | 100.0 /100 | #13 | Exceptional $126,620 |
| Immigrants | South Central Asia | 100.0 /100 | #14 | Exceptional $125,956 |
| Eastern Europeans | 100.0 /100 | #15 | Exceptional $125,546 |
| Immigrants | China | 100.0 /100 | #16 | Exceptional $125,540 |
| Indians (Asian) | 100.0 /100 | #17 | Exceptional $125,312 |
| Immigrants | Eastern Asia | 100.0 /100 | #18 | Exceptional $125,150 |
| Immigrants | Belgium | 100.0 /100 | #19 | Exceptional $123,831 |
| Burmese | 100.0 /100 | #20 | Exceptional $123,369 |
| Immigrants | Korea | 100.0 /100 | #21 | Exceptional $122,800 |
Demographics Similar to Bangladeshis by Median Family Income
In terms of median family income, the demographic groups most similar to Bangladeshis are Indonesian ($88,301, a difference of 0.060%), Guatemalan ($88,295, a difference of 0.070%), Immigrants from Nicaragua ($88,267, a difference of 0.10%), Potawatomi ($88,265, a difference of 0.11%), and Cherokee ($88,209, a difference of 0.17%).
| Demographics | Rating | Rank | Median Family Income |
| Immigrants | Zaire | 0.1 /100 | #276 | Tragic $89,285 |
| Immigrants | Jamaica | 0.1 /100 | #277 | Tragic $89,268 |
| Immigrants | Grenada | 0.1 /100 | #278 | Tragic $89,249 |
| Immigrants | Belize | 0.1 /100 | #279 | Tragic $89,197 |
| British West Indians | 0.1 /100 | #280 | Tragic $88,987 |
| Blackfeet | 0.1 /100 | #281 | Tragic $88,717 |
| Comanche | 0.1 /100 | #282 | Tragic $88,556 |
| Bangladeshis | 0.1 /100 | #283 | Tragic $88,358 |
| Indonesians | 0.1 /100 | #284 | Tragic $88,301 |
| Guatemalans | 0.1 /100 | #285 | Tragic $88,295 |
| Immigrants | Nicaragua | 0.1 /100 | #286 | Tragic $88,267 |
| Potawatomi | 0.1 /100 | #287 | Tragic $88,265 |
| Cherokee | 0.1 /100 | #288 | Tragic $88,209 |
| Central American Indians | 0.1 /100 | #289 | Tragic $88,034 |
| Shoshone | 0.1 /100 | #290 | Tragic $87,872 |