Czech vs Bangladeshi Median Family Income
COMPARE
Czech
Bangladeshi
Median Family Income
Median Family Income Comparison
Czechs
Bangladeshis
$105,839
MEDIAN FAMILY INCOME
83.4/ 100
METRIC RATING
146th/ 347
METRIC RANK
$88,358
MEDIAN FAMILY INCOME
0.1/ 100
METRIC RATING
283rd/ 347
METRIC RANK
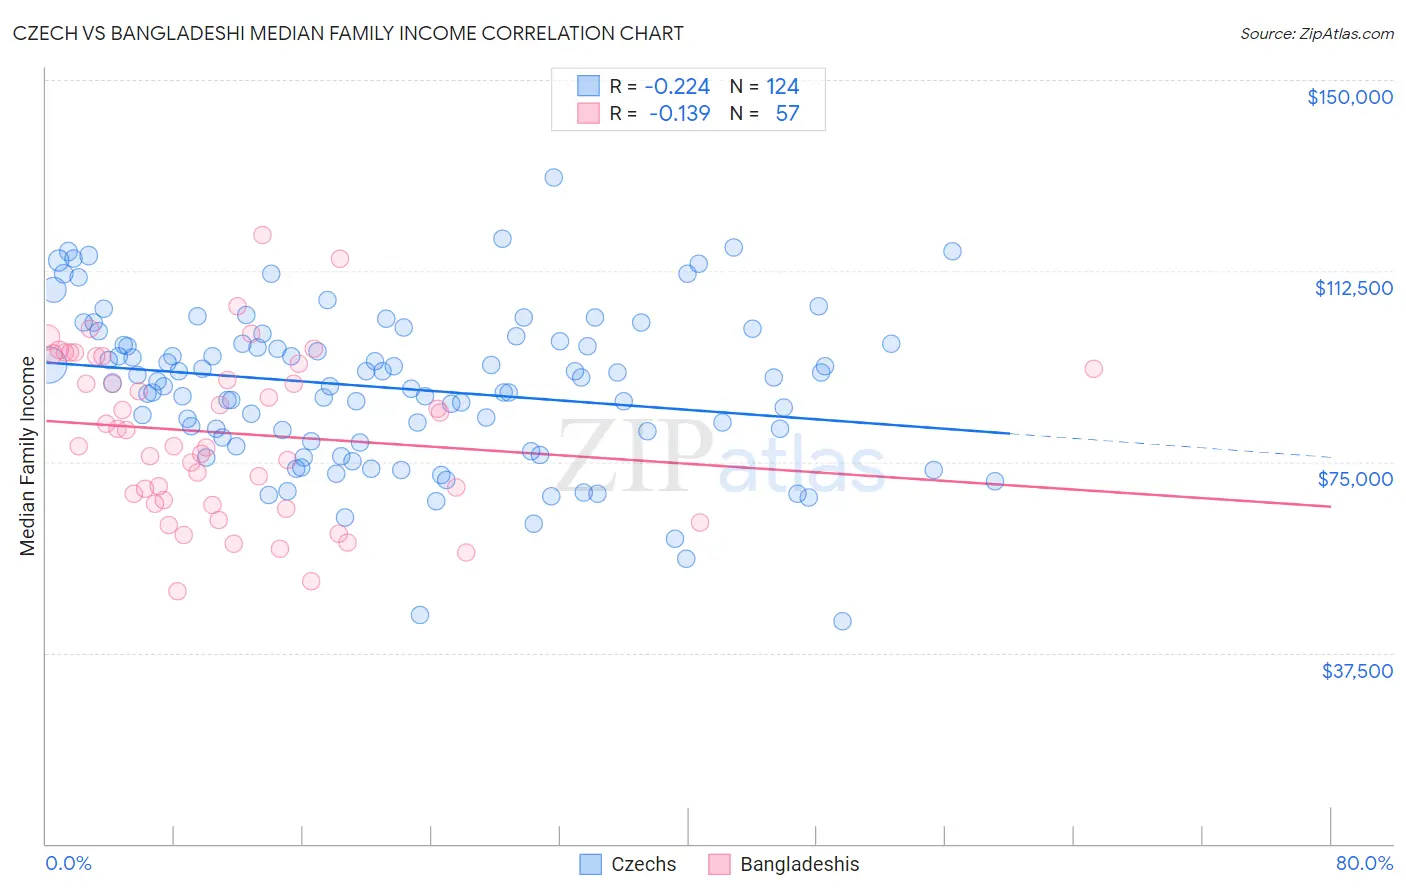
Czech vs Bangladeshi Median Family Income Correlation Chart
The statistical analysis conducted on geographies consisting of 484,215,939 people shows a weak negative correlation between the proportion of Czechs and median family income in the United States with a correlation coefficient (R) of -0.224 and weighted average of $105,839. Similarly, the statistical analysis conducted on geographies consisting of 141,321,089 people shows a poor negative correlation between the proportion of Bangladeshis and median family income in the United States with a correlation coefficient (R) of -0.139 and weighted average of $88,358, a difference of 19.8%.
Median Family Income Correlation Summary
| Measurement | Czech | Bangladeshi |
| Minimum | $43,750 | $49,670 |
| Maximum | $130,730 | $119,471 |
| Range | $86,980 | $69,801 |
| Mean | $89,458 | $80,654 |
| Median | $90,621 | $81,226 |
| Interquartile 25% (IQ1) | $79,002 | $67,095 |
| Interquartile 75% (IQ3) | $98,480 | $94,926 |
| Interquartile Range (IQR) | $19,478 | $27,831 |
| Standard Deviation (Sample) | $15,413 | $16,058 |
| Standard Deviation (Population) | $15,350 | $15,916 |
Similar Demographics by Median Family Income
Demographics Similar to Czechs by Median Family Income
In terms of median family income, the demographic groups most similar to Czechs are Danish ($105,900, a difference of 0.060%), Tongan ($105,967, a difference of 0.12%), Immigrants from Morocco ($105,964, a difference of 0.12%), Slovene ($106,020, a difference of 0.17%), and Immigrants from Chile ($105,655, a difference of 0.17%).
| Demographics | Rating | Rank | Median Family Income |
| Luxembourgers | 85.7 /100 | #139 | Excellent $106,183 |
| Norwegians | 85.5 /100 | #140 | Excellent $106,144 |
| Immigrants | Syria | 85.3 /100 | #141 | Excellent $106,118 |
| Slovenes | 84.7 /100 | #142 | Excellent $106,020 |
| Tongans | 84.3 /100 | #143 | Excellent $105,967 |
| Immigrants | Morocco | 84.3 /100 | #144 | Excellent $105,964 |
| Danes | 83.8 /100 | #145 | Excellent $105,900 |
| Czechs | 83.4 /100 | #146 | Excellent $105,839 |
| Immigrants | Chile | 82.1 /100 | #147 | Excellent $105,655 |
| Hungarians | 81.7 /100 | #148 | Excellent $105,609 |
| Immigrants | Germany | 80.9 /100 | #149 | Excellent $105,507 |
| Irish | 80.5 /100 | #150 | Excellent $105,453 |
| Peruvians | 80.4 /100 | #151 | Excellent $105,444 |
| Immigrants | Albania | 79.1 /100 | #152 | Good $105,285 |
| Slavs | 77.9 /100 | #153 | Good $105,144 |
Demographics Similar to Bangladeshis by Median Family Income
In terms of median family income, the demographic groups most similar to Bangladeshis are Indonesian ($88,301, a difference of 0.060%), Guatemalan ($88,295, a difference of 0.070%), Immigrants from Nicaragua ($88,267, a difference of 0.10%), Potawatomi ($88,265, a difference of 0.11%), and Cherokee ($88,209, a difference of 0.17%).
| Demographics | Rating | Rank | Median Family Income |
| Immigrants | Zaire | 0.1 /100 | #276 | Tragic $89,285 |
| Immigrants | Jamaica | 0.1 /100 | #277 | Tragic $89,268 |
| Immigrants | Grenada | 0.1 /100 | #278 | Tragic $89,249 |
| Immigrants | Belize | 0.1 /100 | #279 | Tragic $89,197 |
| British West Indians | 0.1 /100 | #280 | Tragic $88,987 |
| Blackfeet | 0.1 /100 | #281 | Tragic $88,717 |
| Comanche | 0.1 /100 | #282 | Tragic $88,556 |
| Bangladeshis | 0.1 /100 | #283 | Tragic $88,358 |
| Indonesians | 0.1 /100 | #284 | Tragic $88,301 |
| Guatemalans | 0.1 /100 | #285 | Tragic $88,295 |
| Immigrants | Nicaragua | 0.1 /100 | #286 | Tragic $88,267 |
| Potawatomi | 0.1 /100 | #287 | Tragic $88,265 |
| Cherokee | 0.1 /100 | #288 | Tragic $88,209 |
| Central American Indians | 0.1 /100 | #289 | Tragic $88,034 |
| Shoshone | 0.1 /100 | #290 | Tragic $87,872 |