Nicaraguan vs Italian Median Male Earnings
COMPARE
Nicaraguan
Italian
Median Male Earnings
Median Male Earnings Comparison
Nicaraguans
Italians
$49,215
MEDIAN MALE EARNINGS
0.6/ 100
METRIC RATING
263rd/ 347
METRIC RANK
$59,551
MEDIAN MALE EARNINGS
99.3/ 100
METRIC RATING
85th/ 347
METRIC RANK
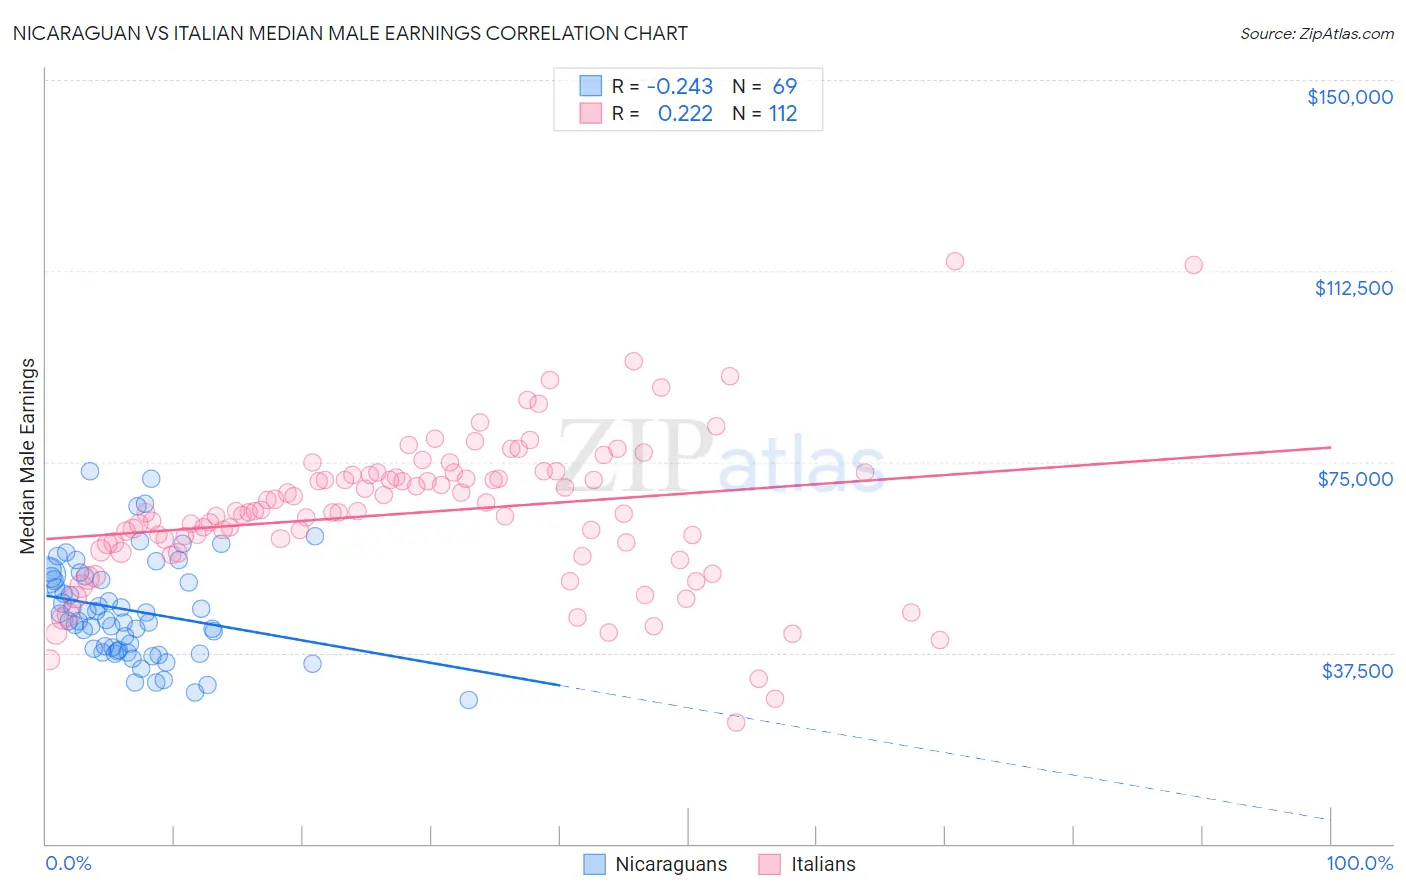
Nicaraguan vs Italian Median Male Earnings Correlation Chart
The statistical analysis conducted on geographies consisting of 285,681,688 people shows a weak negative correlation between the proportion of Nicaraguans and median male earnings in the United States with a correlation coefficient (R) of -0.243 and weighted average of $49,215. Similarly, the statistical analysis conducted on geographies consisting of 573,649,793 people shows a weak positive correlation between the proportion of Italians and median male earnings in the United States with a correlation coefficient (R) of 0.222 and weighted average of $59,551, a difference of 21.0%.
Median Male Earnings Correlation Summary
| Measurement | Nicaraguan | Italian |
| Minimum | $28,353 | $23,704 |
| Maximum | $73,045 | $114,356 |
| Range | $44,692 | $90,652 |
| Mean | $45,837 | $65,064 |
| Median | $43,824 | $65,149 |
| Interquartile 25% (IQ1) | $37,970 | $58,270 |
| Interquartile 75% (IQ3) | $52,426 | $72,487 |
| Interquartile Range (IQR) | $14,456 | $14,217 |
| Standard Deviation (Sample) | $9,879 | $14,744 |
| Standard Deviation (Population) | $9,808 | $14,679 |
Similar Demographics by Median Male Earnings
Demographics Similar to Nicaraguans by Median Male Earnings
In terms of median male earnings, the demographic groups most similar to Nicaraguans are Immigrants from Middle Africa ($49,201, a difference of 0.030%), Immigrants from Laos ($49,190, a difference of 0.050%), Immigrants from West Indies ($49,271, a difference of 0.11%), Liberian ($49,318, a difference of 0.21%), and Iroquois ($49,374, a difference of 0.32%).
| Demographics | Rating | Rank | Median Male Earnings |
| Alaska Natives | 0.9 /100 | #256 | Tragic $49,711 |
| British West Indians | 0.8 /100 | #257 | Tragic $49,636 |
| Cree | 0.7 /100 | #258 | Tragic $49,497 |
| Nepalese | 0.7 /100 | #259 | Tragic $49,458 |
| Iroquois | 0.7 /100 | #260 | Tragic $49,374 |
| Liberians | 0.6 /100 | #261 | Tragic $49,318 |
| Immigrants | West Indies | 0.6 /100 | #262 | Tragic $49,271 |
| Nicaraguans | 0.6 /100 | #263 | Tragic $49,215 |
| Immigrants | Middle Africa | 0.6 /100 | #264 | Tragic $49,201 |
| Immigrants | Laos | 0.6 /100 | #265 | Tragic $49,190 |
| Somalis | 0.5 /100 | #266 | Tragic $49,025 |
| Spanish Americans | 0.5 /100 | #267 | Tragic $49,008 |
| Ute | 0.4 /100 | #268 | Tragic $48,899 |
| Tsimshian | 0.4 /100 | #269 | Tragic $48,836 |
| Potawatomi | 0.4 /100 | #270 | Tragic $48,768 |
Demographics Similar to Italians by Median Male Earnings
In terms of median male earnings, the demographic groups most similar to Italians are Afghan ($59,554, a difference of 0.0%), Immigrants from England ($59,527, a difference of 0.040%), Macedonian ($59,522, a difference of 0.050%), Immigrants from Argentina ($59,491, a difference of 0.10%), and Immigrants from Moldova ($59,417, a difference of 0.23%).
| Demographics | Rating | Rank | Median Male Earnings |
| Immigrants | Egypt | 99.5 /100 | #78 | Exceptional $59,925 |
| Immigrants | Ukraine | 99.5 /100 | #79 | Exceptional $59,820 |
| Immigrants | Hungary | 99.5 /100 | #80 | Exceptional $59,806 |
| Ukrainians | 99.4 /100 | #81 | Exceptional $59,728 |
| Croatians | 99.4 /100 | #82 | Exceptional $59,715 |
| Immigrants | Italy | 99.4 /100 | #83 | Exceptional $59,691 |
| Afghans | 99.3 /100 | #84 | Exceptional $59,554 |
| Italians | 99.3 /100 | #85 | Exceptional $59,551 |
| Immigrants | England | 99.3 /100 | #86 | Exceptional $59,527 |
| Macedonians | 99.3 /100 | #87 | Exceptional $59,522 |
| Immigrants | Argentina | 99.3 /100 | #88 | Exceptional $59,491 |
| Immigrants | Moldova | 99.2 /100 | #89 | Exceptional $59,417 |
| Austrians | 99.2 /100 | #90 | Exceptional $59,359 |
| Laotians | 99.2 /100 | #91 | Exceptional $59,351 |
| Immigrants | Kazakhstan | 99.1 /100 | #92 | Exceptional $59,278 |