Northern European vs Italian Median Male Earnings
COMPARE
Northern European
Italian
Median Male Earnings
Median Male Earnings Comparison
Northern Europeans
Italians
$58,588
MEDIAN MALE EARNINGS
98.2/ 100
METRIC RATING
97th/ 347
METRIC RANK
$59,551
MEDIAN MALE EARNINGS
99.3/ 100
METRIC RATING
85th/ 347
METRIC RANK
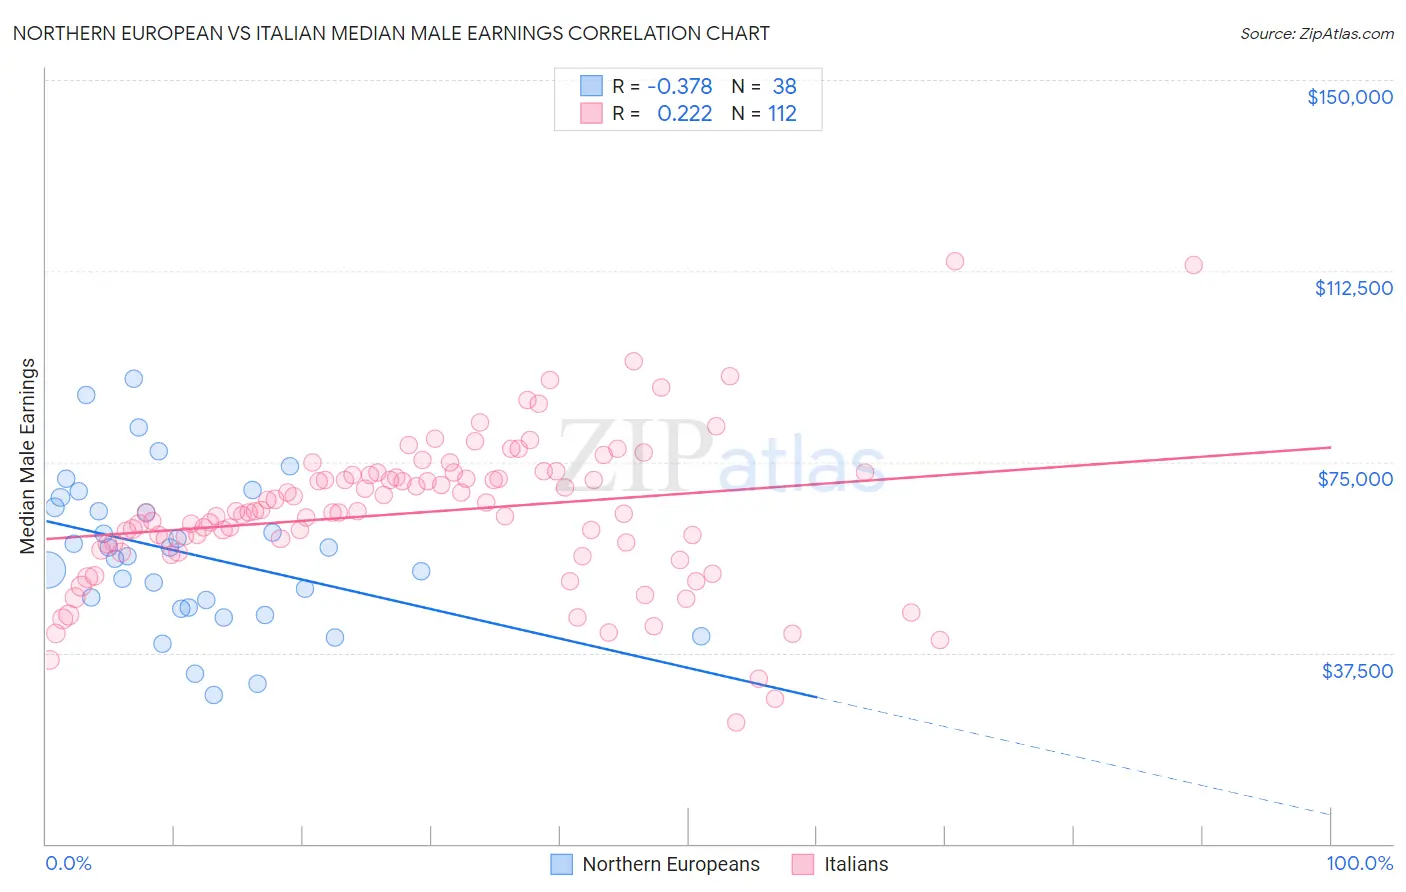
Northern European vs Italian Median Male Earnings Correlation Chart
The statistical analysis conducted on geographies consisting of 405,884,643 people shows a mild negative correlation between the proportion of Northern Europeans and median male earnings in the United States with a correlation coefficient (R) of -0.378 and weighted average of $58,588. Similarly, the statistical analysis conducted on geographies consisting of 573,649,793 people shows a weak positive correlation between the proportion of Italians and median male earnings in the United States with a correlation coefficient (R) of 0.222 and weighted average of $59,551, a difference of 1.6%.
Median Male Earnings Correlation Summary
| Measurement | Northern European | Italian |
| Minimum | $29,177 | $23,704 |
| Maximum | $91,267 | $114,356 |
| Range | $62,090 | $90,652 |
| Mean | $57,049 | $65,064 |
| Median | $57,215 | $65,149 |
| Interquartile 25% (IQ1) | $46,389 | $58,270 |
| Interquartile 75% (IQ3) | $66,077 | $72,487 |
| Interquartile Range (IQR) | $19,687 | $14,217 |
| Standard Deviation (Sample) | $14,710 | $14,744 |
| Standard Deviation (Population) | $14,515 | $14,679 |
Demographics Similar to Northern Europeans and Italians by Median Male Earnings
In terms of median male earnings, the demographic groups most similar to Northern Europeans are Jordanian ($58,500, a difference of 0.15%), Albanian ($58,680, a difference of 0.16%), Immigrants from Poland ($58,452, a difference of 0.23%), Assyrian/Chaldean/Syriac ($58,437, a difference of 0.26%), and Immigrants from Lebanon ($58,835, a difference of 0.42%). Similarly, the demographic groups most similar to Italians are Afghan ($59,554, a difference of 0.0%), Immigrants from England ($59,527, a difference of 0.040%), Macedonian ($59,522, a difference of 0.050%), Immigrants from Argentina ($59,491, a difference of 0.10%), and Immigrants from Moldova ($59,417, a difference of 0.23%).
| Demographics | Rating | Rank | Median Male Earnings |
| Ukrainians | 99.4 /100 | #81 | Exceptional $59,728 |
| Croatians | 99.4 /100 | #82 | Exceptional $59,715 |
| Immigrants | Italy | 99.4 /100 | #83 | Exceptional $59,691 |
| Afghans | 99.3 /100 | #84 | Exceptional $59,554 |
| Italians | 99.3 /100 | #85 | Exceptional $59,551 |
| Immigrants | England | 99.3 /100 | #86 | Exceptional $59,527 |
| Macedonians | 99.3 /100 | #87 | Exceptional $59,522 |
| Immigrants | Argentina | 99.3 /100 | #88 | Exceptional $59,491 |
| Immigrants | Moldova | 99.2 /100 | #89 | Exceptional $59,417 |
| Austrians | 99.2 /100 | #90 | Exceptional $59,359 |
| Laotians | 99.2 /100 | #91 | Exceptional $59,351 |
| Immigrants | Kazakhstan | 99.1 /100 | #92 | Exceptional $59,278 |
| Immigrants | Southern Europe | 99.0 /100 | #93 | Exceptional $59,217 |
| Immigrants | North Macedonia | 99.0 /100 | #94 | Exceptional $59,189 |
| Immigrants | Lebanon | 98.6 /100 | #95 | Exceptional $58,835 |
| Albanians | 98.4 /100 | #96 | Exceptional $58,680 |
| Northern Europeans | 98.2 /100 | #97 | Exceptional $58,588 |
| Jordanians | 98.1 /100 | #98 | Exceptional $58,500 |
| Immigrants | Poland | 98.0 /100 | #99 | Exceptional $58,452 |
| Assyrians/Chaldeans/Syriacs | 97.9 /100 | #100 | Exceptional $58,437 |
| Immigrants | Brazil | 97.7 /100 | #101 | Exceptional $58,324 |