Greek vs Italian Seniors Poverty Over the Age of 75
COMPARE
Greek
Italian
Seniors Poverty Over the Age of 75
Seniors Poverty Over the Age of 75 Comparison
Greeks
Italians
11.1%
SENIORS POVERTY OVER THE AGE OF 75
99.0/ 100
METRIC RATING
46th/ 347
METRIC RANK
10.8%
SENIORS POVERTY OVER THE AGE OF 75
99.7/ 100
METRIC RATING
34th/ 347
METRIC RANK
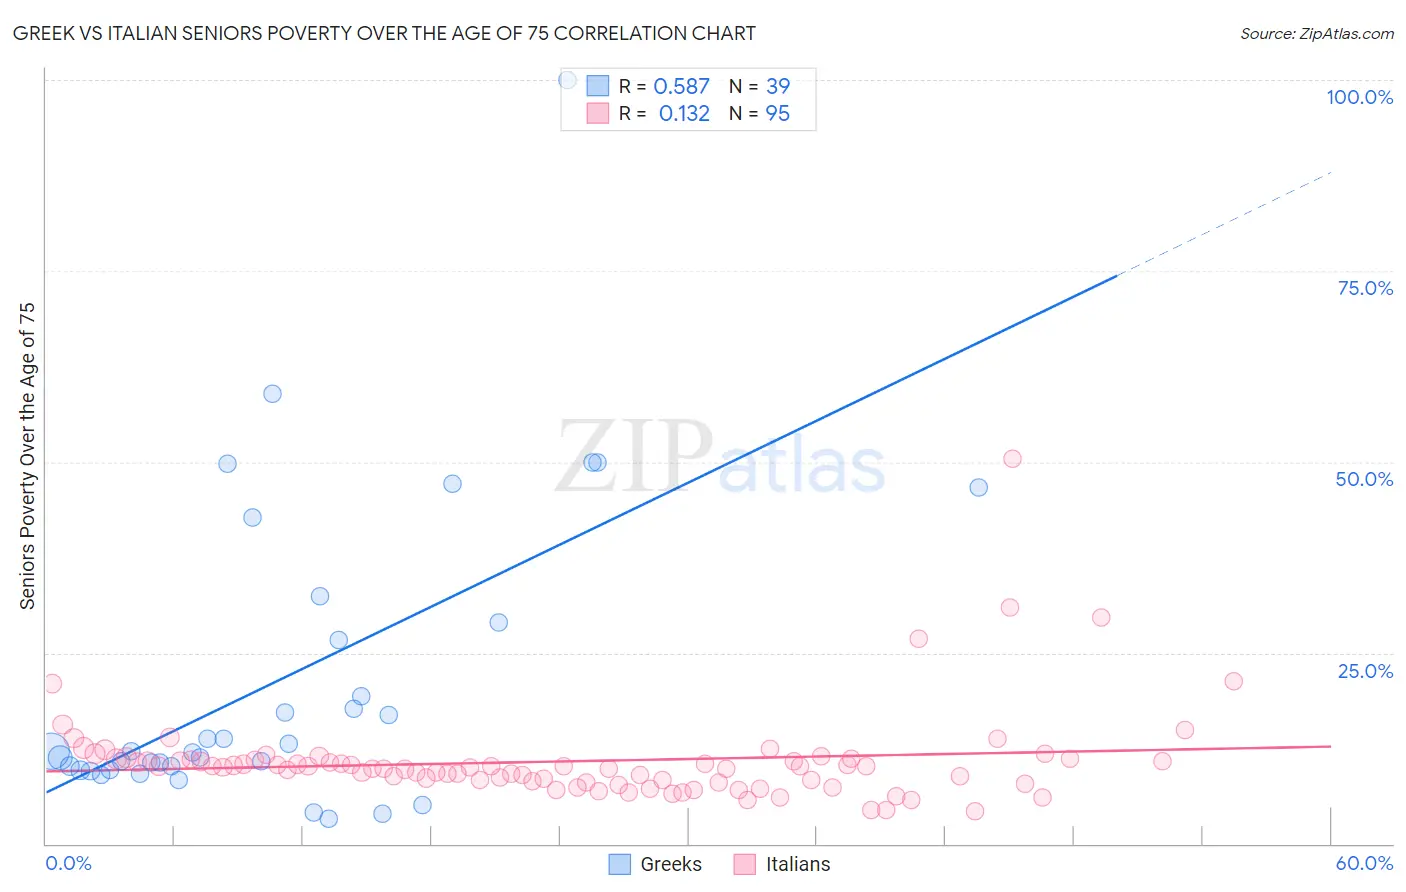
Greek vs Italian Seniors Poverty Over the Age of 75 Correlation Chart
The statistical analysis conducted on geographies consisting of 474,334,597 people shows a substantial positive correlation between the proportion of Greeks and poverty level among seniors over the age of 75 in the United States with a correlation coefficient (R) of 0.587 and weighted average of 11.1%. Similarly, the statistical analysis conducted on geographies consisting of 557,339,767 people shows a poor positive correlation between the proportion of Italians and poverty level among seniors over the age of 75 in the United States with a correlation coefficient (R) of 0.132 and weighted average of 10.8%, a difference of 2.8%.
Seniors Poverty Over the Age of 75 Correlation Summary
| Measurement | Greek | Italian |
| Minimum | 3.3% | 4.3% |
| Maximum | 100.0% | 50.4% |
| Range | 96.7% | 46.0% |
| Mean | 21.5% | 10.8% |
| Median | 12.1% | 10.0% |
| Interquartile 25% (IQ1) | 9.7% | 8.3% |
| Interquartile 75% (IQ3) | 29.0% | 11.0% |
| Interquartile Range (IQR) | 19.3% | 2.8% |
| Standard Deviation (Sample) | 20.2% | 6.0% |
| Standard Deviation (Population) | 19.9% | 6.0% |
Demographics Similar to Greeks and Italians by Seniors Poverty Over the Age of 75
In terms of seniors poverty over the age of 75, the demographic groups most similar to Greeks are Carpatho Rusyn (11.1%, a difference of 0.060%), Belgian (11.0%, a difference of 0.33%), Celtic (11.0%, a difference of 0.36%), Austrian (11.0%, a difference of 0.42%), and Hawaiian (11.1%, a difference of 0.44%). Similarly, the demographic groups most similar to Italians are Puget Sound Salish (10.8%, a difference of 0.050%), British (10.7%, a difference of 0.11%), Marshallese (10.7%, a difference of 0.25%), Luxembourger (10.8%, a difference of 0.38%), and Swiss (10.7%, a difference of 0.43%).
| Demographics | Rating | Rank | Seniors Poverty Over the Age of 75 |
| Swiss | 99.7 /100 | #30 | Exceptional 10.7% |
| Marshallese | 99.7 /100 | #31 | Exceptional 10.7% |
| British | 99.7 /100 | #32 | Exceptional 10.7% |
| Puget Sound Salish | 99.7 /100 | #33 | Exceptional 10.8% |
| Italians | 99.7 /100 | #34 | Exceptional 10.8% |
| Luxembourgers | 99.6 /100 | #35 | Exceptional 10.8% |
| Scotch-Irish | 99.6 /100 | #36 | Exceptional 10.8% |
| Latvians | 99.6 /100 | #37 | Exceptional 10.8% |
| Finns | 99.6 /100 | #38 | Exceptional 10.8% |
| Czechoslovakians | 99.4 /100 | #39 | Exceptional 10.9% |
| Thais | 99.4 /100 | #40 | Exceptional 10.9% |
| Immigrants | Lithuania | 99.2 /100 | #41 | Exceptional 11.0% |
| Austrians | 99.1 /100 | #42 | Exceptional 11.0% |
| Celtics | 99.1 /100 | #43 | Exceptional 11.0% |
| Belgians | 99.1 /100 | #44 | Exceptional 11.0% |
| Carpatho Rusyns | 99.0 /100 | #45 | Exceptional 11.1% |
| Greeks | 99.0 /100 | #46 | Exceptional 11.1% |
| Hawaiians | 98.8 /100 | #47 | Exceptional 11.1% |
| French | 98.7 /100 | #48 | Exceptional 11.1% |
| Samoans | 98.7 /100 | #49 | Exceptional 11.1% |
| Serbians | 98.6 /100 | #50 | Exceptional 11.1% |