Welsh vs Italian Median Male Earnings
COMPARE
Welsh
Italian
Median Male Earnings
Median Male Earnings Comparison
Welsh
Italians
$54,647
MEDIAN MALE EARNINGS
53.8/ 100
METRIC RATING
172nd/ 347
METRIC RANK
$59,551
MEDIAN MALE EARNINGS
99.3/ 100
METRIC RATING
85th/ 347
METRIC RANK
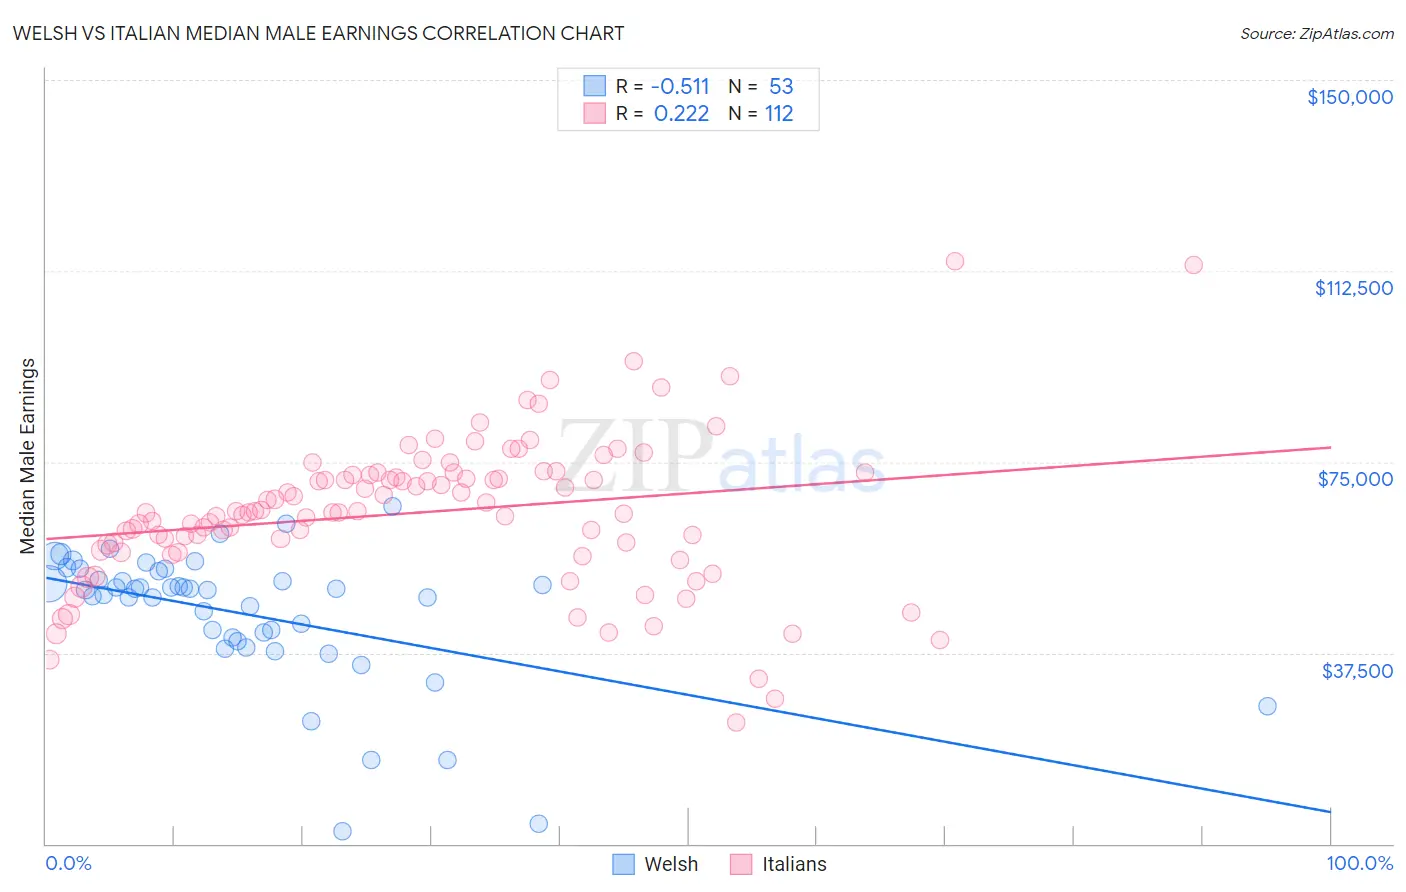
Welsh vs Italian Median Male Earnings Correlation Chart
The statistical analysis conducted on geographies consisting of 527,949,095 people shows a substantial negative correlation between the proportion of Welsh and median male earnings in the United States with a correlation coefficient (R) of -0.511 and weighted average of $54,647. Similarly, the statistical analysis conducted on geographies consisting of 573,649,793 people shows a weak positive correlation between the proportion of Italians and median male earnings in the United States with a correlation coefficient (R) of 0.222 and weighted average of $59,551, a difference of 9.0%.
Median Male Earnings Correlation Summary
| Measurement | Welsh | Italian |
| Minimum | $2,499 | $23,704 |
| Maximum | $66,364 | $114,356 |
| Range | $63,865 | $90,652 |
| Mean | $45,194 | $65,064 |
| Median | $49,839 | $65,149 |
| Interquartile 25% (IQ1) | $40,118 | $58,270 |
| Interquartile 75% (IQ3) | $52,741 | $72,487 |
| Interquartile Range (IQR) | $12,623 | $14,217 |
| Standard Deviation (Sample) | $13,217 | $14,744 |
| Standard Deviation (Population) | $13,092 | $14,679 |
Similar Demographics by Median Male Earnings
Demographics Similar to Welsh by Median Male Earnings
In terms of median male earnings, the demographic groups most similar to Welsh are Immigrants from Peru ($54,695, a difference of 0.090%), French Canadian ($54,722, a difference of 0.14%), Finnish ($54,721, a difference of 0.14%), South American Indian ($54,508, a difference of 0.25%), and South American ($54,492, a difference of 0.28%).
| Demographics | Rating | Rank | Median Male Earnings |
| Immigrants | Portugal | 66.3 /100 | #165 | Good $55,182 |
| Germans | 61.6 /100 | #166 | Good $54,974 |
| Immigrants | Fiji | 61.2 /100 | #167 | Good $54,958 |
| Immigrants | Vietnam | 60.2 /100 | #168 | Good $54,913 |
| French Canadians | 55.6 /100 | #169 | Average $54,722 |
| Finns | 55.6 /100 | #170 | Average $54,721 |
| Immigrants | Peru | 54.9 /100 | #171 | Average $54,695 |
| Welsh | 53.8 /100 | #172 | Average $54,647 |
| South American Indians | 50.4 /100 | #173 | Average $54,508 |
| South Americans | 50.0 /100 | #174 | Average $54,492 |
| Dutch | 48.0 /100 | #175 | Average $54,410 |
| Spaniards | 47.8 /100 | #176 | Average $54,401 |
| Costa Ricans | 44.8 /100 | #177 | Average $54,279 |
| Sierra Leoneans | 44.8 /100 | #178 | Average $54,279 |
| Celtics | 43.9 /100 | #179 | Average $54,242 |
Demographics Similar to Italians by Median Male Earnings
In terms of median male earnings, the demographic groups most similar to Italians are Afghan ($59,554, a difference of 0.0%), Immigrants from England ($59,527, a difference of 0.040%), Macedonian ($59,522, a difference of 0.050%), Immigrants from Argentina ($59,491, a difference of 0.10%), and Immigrants from Moldova ($59,417, a difference of 0.23%).
| Demographics | Rating | Rank | Median Male Earnings |
| Immigrants | Egypt | 99.5 /100 | #78 | Exceptional $59,925 |
| Immigrants | Ukraine | 99.5 /100 | #79 | Exceptional $59,820 |
| Immigrants | Hungary | 99.5 /100 | #80 | Exceptional $59,806 |
| Ukrainians | 99.4 /100 | #81 | Exceptional $59,728 |
| Croatians | 99.4 /100 | #82 | Exceptional $59,715 |
| Immigrants | Italy | 99.4 /100 | #83 | Exceptional $59,691 |
| Afghans | 99.3 /100 | #84 | Exceptional $59,554 |
| Italians | 99.3 /100 | #85 | Exceptional $59,551 |
| Immigrants | England | 99.3 /100 | #86 | Exceptional $59,527 |
| Macedonians | 99.3 /100 | #87 | Exceptional $59,522 |
| Immigrants | Argentina | 99.3 /100 | #88 | Exceptional $59,491 |
| Immigrants | Moldova | 99.2 /100 | #89 | Exceptional $59,417 |
| Austrians | 99.2 /100 | #90 | Exceptional $59,359 |
| Laotians | 99.2 /100 | #91 | Exceptional $59,351 |
| Immigrants | Kazakhstan | 99.1 /100 | #92 | Exceptional $59,278 |