German vs Central American Median Female Earnings
COMPARE
German
Central American
Median Female Earnings
Median Female Earnings Comparison
Germans
Central Americans
$37,986
MEDIAN FEMALE EARNINGS
2.8/ 100
METRIC RATING
243rd/ 347
METRIC RANK
$36,492
MEDIAN FEMALE EARNINGS
0.1/ 100
METRIC RATING
276th/ 347
METRIC RANK
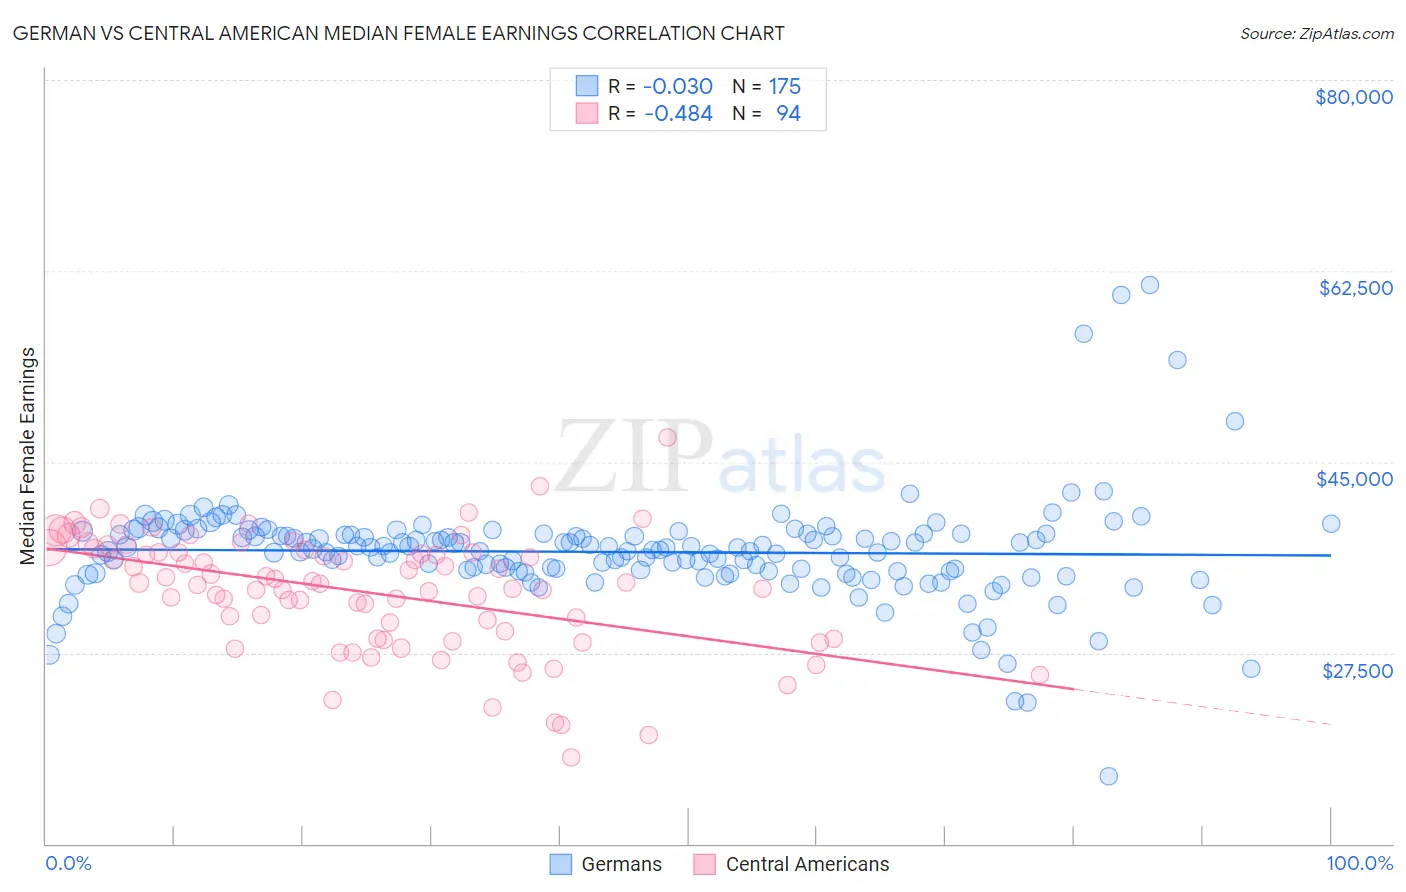
German vs Central American Median Female Earnings Correlation Chart
The statistical analysis conducted on geographies consisting of 578,410,378 people shows no correlation between the proportion of Germans and median female earnings in the United States with a correlation coefficient (R) of -0.030 and weighted average of $37,986. Similarly, the statistical analysis conducted on geographies consisting of 504,159,806 people shows a moderate negative correlation between the proportion of Central Americans and median female earnings in the United States with a correlation coefficient (R) of -0.484 and weighted average of $36,492, a difference of 4.1%.
Median Female Earnings Correlation Summary
| Measurement | German | Central American |
| Minimum | $16,161 | $17,895 |
| Maximum | $61,250 | $47,188 |
| Range | $45,089 | $29,293 |
| Mean | $36,748 | $33,080 |
| Median | $36,985 | $33,869 |
| Interquartile 25% (IQ1) | $34,926 | $28,801 |
| Interquartile 75% (IQ3) | $38,384 | $36,751 |
| Interquartile Range (IQR) | $3,458 | $7,950 |
| Standard Deviation (Sample) | $4,922 | $5,364 |
| Standard Deviation (Population) | $4,908 | $5,336 |
Similar Demographics by Median Female Earnings
Demographics Similar to Germans by Median Female Earnings
In terms of median female earnings, the demographic groups most similar to Germans are Immigrants from Liberia ($37,970, a difference of 0.040%), Immigrants from Middle Africa ($37,965, a difference of 0.050%), Delaware ($37,964, a difference of 0.060%), Immigrants from Burma/Myanmar ($38,028, a difference of 0.11%), and Immigrants from Somalia ($37,914, a difference of 0.19%).
| Demographics | Rating | Rank | Median Female Earnings |
| Liberians | 4.4 /100 | #236 | Tragic $38,215 |
| Immigrants | Cabo Verde | 4.3 /100 | #237 | Tragic $38,208 |
| Alaska Natives | 4.3 /100 | #238 | Tragic $38,202 |
| English | 4.2 /100 | #239 | Tragic $38,196 |
| Finns | 4.0 /100 | #240 | Tragic $38,173 |
| Spanish | 3.5 /100 | #241 | Tragic $38,098 |
| Immigrants | Burma/Myanmar | 3.0 /100 | #242 | Tragic $38,028 |
| Germans | 2.8 /100 | #243 | Tragic $37,986 |
| Immigrants | Liberia | 2.7 /100 | #244 | Tragic $37,970 |
| Immigrants | Middle Africa | 2.7 /100 | #245 | Tragic $37,965 |
| Delaware | 2.6 /100 | #246 | Tragic $37,964 |
| Immigrants | Somalia | 2.4 /100 | #247 | Tragic $37,914 |
| Alaskan Athabascans | 2.3 /100 | #248 | Tragic $37,905 |
| Swiss | 2.3 /100 | #249 | Tragic $37,904 |
| Immigrants | Iraq | 2.2 /100 | #250 | Tragic $37,864 |
Demographics Similar to Central Americans by Median Female Earnings
In terms of median female earnings, the demographic groups most similar to Central Americans are Marshallese ($36,459, a difference of 0.090%), African ($36,530, a difference of 0.10%), U.S. Virgin Islander ($36,424, a difference of 0.19%), Immigrants from Caribbean ($36,414, a difference of 0.22%), and Iroquois ($36,408, a difference of 0.23%).
| Demographics | Rating | Rank | Median Female Earnings |
| Immigrants | Venezuela | 0.4 /100 | #269 | Tragic $37,003 |
| French American Indians | 0.3 /100 | #270 | Tragic $36,920 |
| Nicaraguans | 0.3 /100 | #271 | Tragic $36,904 |
| Immigrants | Dominican Republic | 0.3 /100 | #272 | Tragic $36,857 |
| Immigrants | Laos | 0.3 /100 | #273 | Tragic $36,841 |
| Immigrants | El Salvador | 0.2 /100 | #274 | Tragic $36,673 |
| Africans | 0.1 /100 | #275 | Tragic $36,530 |
| Central Americans | 0.1 /100 | #276 | Tragic $36,492 |
| Marshallese | 0.1 /100 | #277 | Tragic $36,459 |
| U.S. Virgin Islanders | 0.1 /100 | #278 | Tragic $36,424 |
| Immigrants | Caribbean | 0.1 /100 | #279 | Tragic $36,414 |
| Iroquois | 0.1 /100 | #280 | Tragic $36,408 |
| Spanish Americans | 0.1 /100 | #281 | Tragic $36,391 |
| Haitians | 0.1 /100 | #282 | Tragic $36,374 |
| Immigrants | Haiti | 0.1 /100 | #283 | Tragic $36,203 |