Filipino vs Puget Sound Salish Seniors Poverty Over the Age of 65
COMPARE
Filipino
Puget Sound Salish
Seniors Poverty Over the Age of 65
Seniors Poverty Over the Age of 65 Comparison
Filipinos
Puget Sound Salish
9.7%
SENIORS POVERTY OVER THE AGE OF 65
99.3/ 100
METRIC RATING
52nd/ 347
METRIC RANK
10.1%
SENIORS POVERTY OVER THE AGE OF 65
96.9/ 100
METRIC RATING
91st/ 347
METRIC RANK
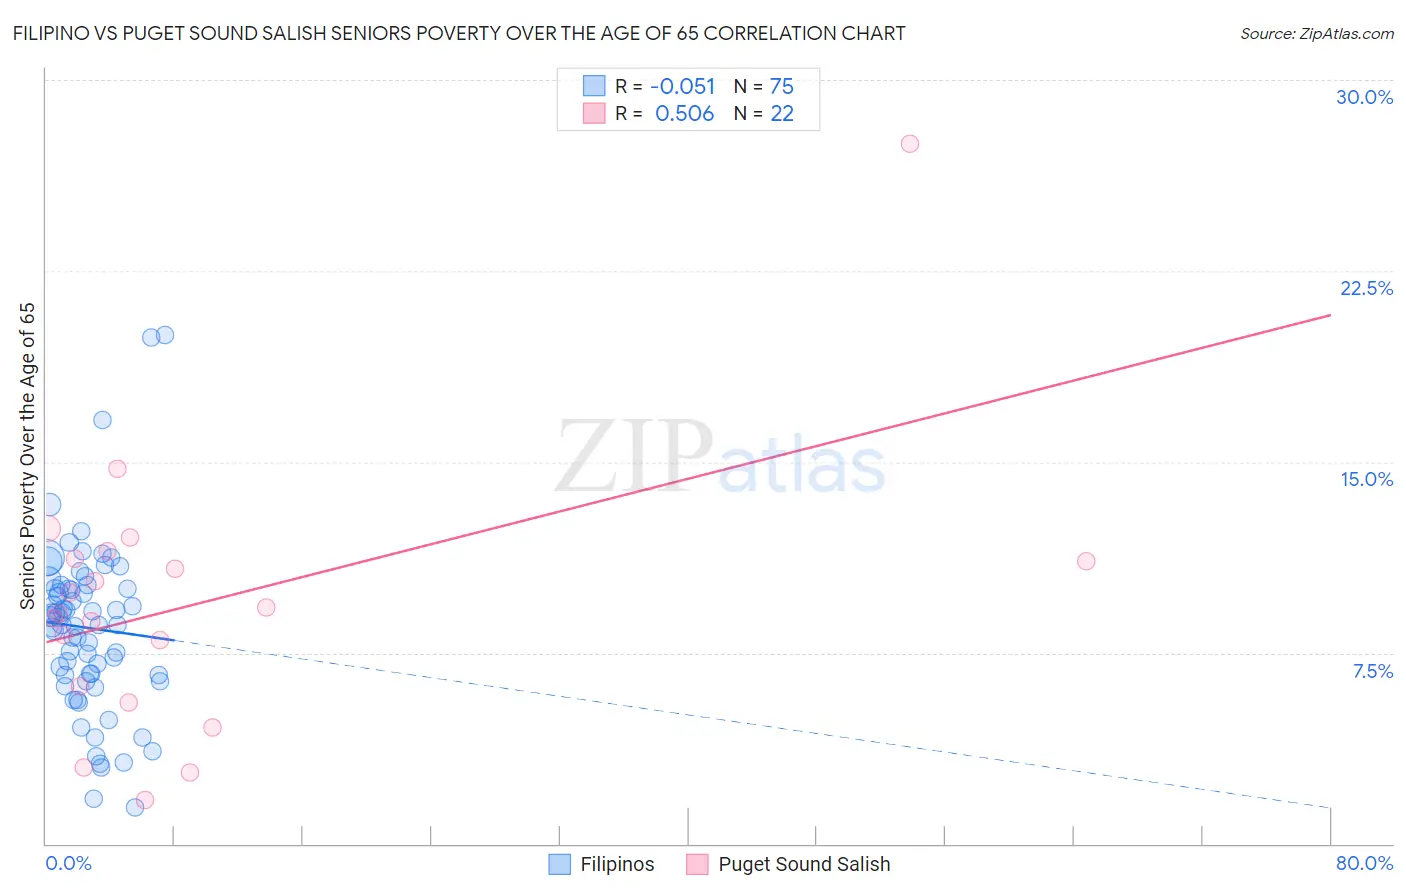
Filipino vs Puget Sound Salish Seniors Poverty Over the Age of 65 Correlation Chart
The statistical analysis conducted on geographies consisting of 253,734,434 people shows a slight negative correlation between the proportion of Filipinos and poverty level among seniors over the age of 65 in the United States with a correlation coefficient (R) of -0.051 and weighted average of 9.7%. Similarly, the statistical analysis conducted on geographies consisting of 46,057,479 people shows a substantial positive correlation between the proportion of Puget Sound Salish and poverty level among seniors over the age of 65 in the United States with a correlation coefficient (R) of 0.506 and weighted average of 10.1%, a difference of 3.6%.
Seniors Poverty Over the Age of 65 Correlation Summary
| Measurement | Filipino | Puget Sound Salish |
| Minimum | 1.4% | 1.7% |
| Maximum | 20.0% | 27.5% |
| Range | 18.6% | 25.8% |
| Mean | 8.5% | 9.4% |
| Median | 8.6% | 9.2% |
| Interquartile 25% (IQ1) | 6.6% | 6.2% |
| Interquartile 75% (IQ3) | 10.0% | 11.2% |
| Interquartile Range (IQR) | 3.4% | 5.0% |
| Standard Deviation (Sample) | 3.4% | 5.3% |
| Standard Deviation (Population) | 3.3% | 5.1% |
Similar Demographics by Seniors Poverty Over the Age of 65
Demographics Similar to Filipinos by Seniors Poverty Over the Age of 65
In terms of seniors poverty over the age of 65, the demographic groups most similar to Filipinos are Carpatho Rusyn (9.7%, a difference of 0.020%), Slavic (9.8%, a difference of 0.11%), Immigrants from Northern Europe (9.8%, a difference of 0.16%), Afghan (9.8%, a difference of 0.29%), and Immigrants from England (9.8%, a difference of 0.41%).
| Demographics | Rating | Rank | Seniors Poverty Over the Age of 65 |
| Estonians | 99.5 /100 | #45 | Exceptional 9.6% |
| Immigrants | Taiwan | 99.5 /100 | #46 | Exceptional 9.7% |
| Immigrants | South Central Asia | 99.5 /100 | #47 | Exceptional 9.7% |
| French | 99.5 /100 | #48 | Exceptional 9.7% |
| Immigrants | Lithuania | 99.4 /100 | #49 | Exceptional 9.7% |
| Hungarians | 99.4 /100 | #50 | Exceptional 9.7% |
| Carpatho Rusyns | 99.3 /100 | #51 | Exceptional 9.7% |
| Filipinos | 99.3 /100 | #52 | Exceptional 9.7% |
| Slavs | 99.2 /100 | #53 | Exceptional 9.8% |
| Immigrants | Northern Europe | 99.2 /100 | #54 | Exceptional 9.8% |
| Afghans | 99.2 /100 | #55 | Exceptional 9.8% |
| Immigrants | England | 99.1 /100 | #56 | Exceptional 9.8% |
| Bolivians | 99.1 /100 | #57 | Exceptional 9.8% |
| Serbians | 99.1 /100 | #58 | Exceptional 9.8% |
| Immigrants | Canada | 99.0 /100 | #59 | Exceptional 9.8% |
Demographics Similar to Puget Sound Salish by Seniors Poverty Over the Age of 65
In terms of seniors poverty over the age of 65, the demographic groups most similar to Puget Sound Salish are Ukrainian (10.1%, a difference of 0.020%), Immigrants from Singapore (10.1%, a difference of 0.020%), Immigrants from Bulgaria (10.1%, a difference of 0.080%), Immigrants from Sweden (10.1%, a difference of 0.13%), and Jordanian (10.1%, a difference of 0.16%).
| Demographics | Rating | Rank | Seniors Poverty Over the Age of 65 |
| Immigrants | Afghanistan | 97.2 /100 | #84 | Exceptional 10.1% |
| Immigrants | Nepal | 97.2 /100 | #85 | Exceptional 10.1% |
| Romanians | 97.2 /100 | #86 | Exceptional 10.1% |
| Burmese | 97.2 /100 | #87 | Exceptional 10.1% |
| Jordanians | 97.1 /100 | #88 | Exceptional 10.1% |
| Immigrants | Bulgaria | 97.0 /100 | #89 | Exceptional 10.1% |
| Ukrainians | 96.9 /100 | #90 | Exceptional 10.1% |
| Puget Sound Salish | 96.9 /100 | #91 | Exceptional 10.1% |
| Immigrants | Singapore | 96.9 /100 | #92 | Exceptional 10.1% |
| Immigrants | Sweden | 96.7 /100 | #93 | Exceptional 10.1% |
| Immigrants | Germany | 96.7 /100 | #94 | Exceptional 10.1% |
| Immigrants | Japan | 96.3 /100 | #95 | Exceptional 10.1% |
| Basques | 95.9 /100 | #96 | Exceptional 10.2% |
| Immigrants | Pakistan | 95.7 /100 | #97 | Exceptional 10.2% |
| Immigrants | Kuwait | 95.5 /100 | #98 | Exceptional 10.2% |