Filipino vs Jordanian Per Capita Income
COMPARE
Filipino
Jordanian
Per Capita Income
Per Capita Income Comparison
Filipinos
Jordanians
$59,066
PER CAPITA INCOME
100.0/ 100
METRIC RATING
1st/ 347
METRIC RANK
$45,605
PER CAPITA INCOME
89.9/ 100
METRIC RATING
132nd/ 347
METRIC RANK
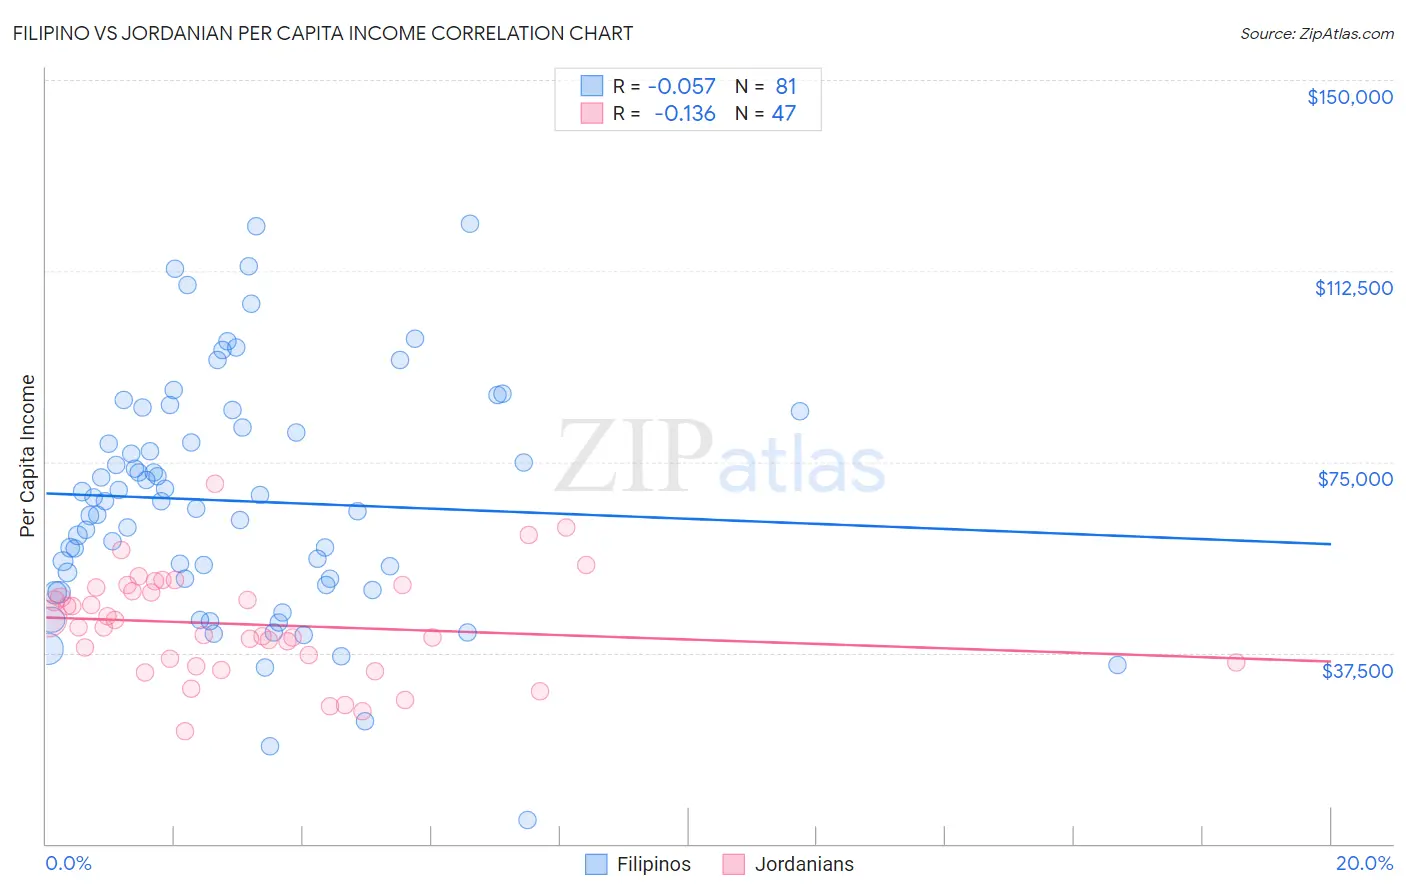
Filipino vs Jordanian Per Capita Income Correlation Chart
The statistical analysis conducted on geographies consisting of 254,359,894 people shows a slight negative correlation between the proportion of Filipinos and per capita income in the United States with a correlation coefficient (R) of -0.057 and weighted average of $59,066. Similarly, the statistical analysis conducted on geographies consisting of 166,389,755 people shows a poor negative correlation between the proportion of Jordanians and per capita income in the United States with a correlation coefficient (R) of -0.136 and weighted average of $45,605, a difference of 29.5%.
Per Capita Income Correlation Summary
| Measurement | Filipino | Jordanian |
| Minimum | $4,657 | $22,143 |
| Maximum | $121,798 | $70,697 |
| Range | $117,141 | $48,554 |
| Mean | $67,314 | $43,077 |
| Median | $67,249 | $42,576 |
| Interquartile 25% (IQ1) | $51,364 | $35,594 |
| Interquartile 75% (IQ3) | $83,421 | $50,277 |
| Interquartile Range (IQR) | $32,057 | $14,683 |
| Standard Deviation (Sample) | $23,294 | $10,214 |
| Standard Deviation (Population) | $23,149 | $10,105 |
Similar Demographics by Per Capita Income
Demographics Similar to Filipinos by Per Capita Income
In terms of per capita income, the demographic groups most similar to Filipinos are Iranian ($58,786, a difference of 0.48%), Immigrants from Singapore ($58,353, a difference of 1.2%), Immigrants from Australia ($57,953, a difference of 1.9%), Immigrants from Iran ($57,759, a difference of 2.3%), and Immigrants from Taiwan ($57,742, a difference of 2.3%).
| Demographics | Rating | Rank | Per Capita Income |
| Filipinos | 100.0 /100 | #1 | Exceptional $59,066 |
| Iranians | 100.0 /100 | #2 | Exceptional $58,786 |
| Immigrants | Singapore | 100.0 /100 | #3 | Exceptional $58,353 |
| Immigrants | Australia | 100.0 /100 | #4 | Exceptional $57,953 |
| Immigrants | Iran | 100.0 /100 | #5 | Exceptional $57,759 |
| Immigrants | Taiwan | 100.0 /100 | #6 | Exceptional $57,742 |
| Immigrants | Israel | 100.0 /100 | #7 | Exceptional $57,384 |
| Immigrants | Hong Kong | 100.0 /100 | #8 | Exceptional $56,709 |
| Immigrants | Ireland | 100.0 /100 | #9 | Exceptional $56,584 |
| Okinawans | 100.0 /100 | #10 | Exceptional $55,817 |
| Eastern Europeans | 100.0 /100 | #11 | Exceptional $55,780 |
| Immigrants | Sweden | 100.0 /100 | #12 | Exceptional $55,582 |
| Immigrants | India | 100.0 /100 | #13 | Exceptional $55,268 |
| Immigrants | Belgium | 100.0 /100 | #14 | Exceptional $55,082 |
| Cypriots | 100.0 /100 | #15 | Exceptional $54,899 |
Demographics Similar to Jordanians by Per Capita Income
In terms of per capita income, the demographic groups most similar to Jordanians are Immigrants from North Macedonia ($45,622, a difference of 0.040%), Pakistani ($45,587, a difference of 0.040%), Slovene ($45,581, a difference of 0.050%), Arab ($45,662, a difference of 0.12%), and Luxembourger ($45,663, a difference of 0.13%).
| Demographics | Rating | Rank | Per Capita Income |
| Zimbabweans | 91.7 /100 | #125 | Exceptional $45,804 |
| Palestinians | 91.6 /100 | #126 | Exceptional $45,790 |
| Immigrants | Germany | 91.3 /100 | #127 | Exceptional $45,751 |
| Swedes | 91.3 /100 | #128 | Exceptional $45,750 |
| Luxembourgers | 90.4 /100 | #129 | Exceptional $45,663 |
| Arabs | 90.4 /100 | #130 | Exceptional $45,662 |
| Immigrants | North Macedonia | 90.0 /100 | #131 | Exceptional $45,622 |
| Jordanians | 89.9 /100 | #132 | Excellent $45,605 |
| Pakistanis | 89.7 /100 | #133 | Excellent $45,587 |
| Slovenes | 89.6 /100 | #134 | Excellent $45,581 |
| Hungarians | 87.9 /100 | #135 | Excellent $45,426 |
| Immigrants | Oceania | 85.2 /100 | #136 | Excellent $45,220 |
| Immigrants | Syria | 85.2 /100 | #137 | Excellent $45,218 |
| Assyrians/Chaldeans/Syriacs | 84.8 /100 | #138 | Excellent $45,195 |
| Basques | 83.2 /100 | #139 | Excellent $45,086 |