Belizean vs Jordanian Per Capita Income
COMPARE
Belizean
Jordanian
Per Capita Income
Per Capita Income Comparison
Belizeans
Jordanians
$39,097
PER CAPITA INCOME
0.6/ 100
METRIC RATING
263rd/ 347
METRIC RANK
$45,605
PER CAPITA INCOME
89.9/ 100
METRIC RATING
132nd/ 347
METRIC RANK
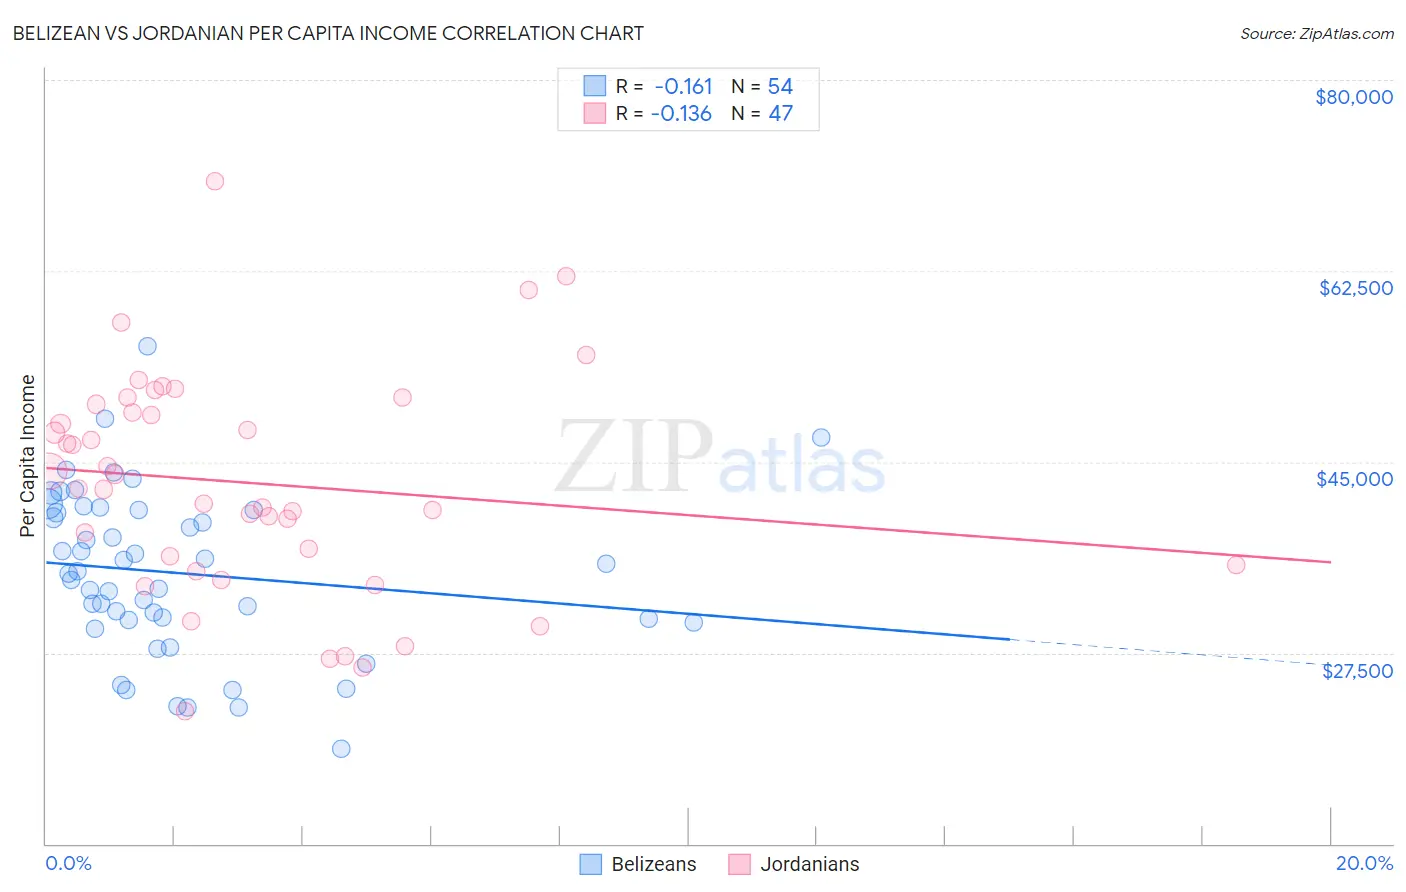
Belizean vs Jordanian Per Capita Income Correlation Chart
The statistical analysis conducted on geographies consisting of 144,225,006 people shows a poor negative correlation between the proportion of Belizeans and per capita income in the United States with a correlation coefficient (R) of -0.161 and weighted average of $39,097. Similarly, the statistical analysis conducted on geographies consisting of 166,389,755 people shows a poor negative correlation between the proportion of Jordanians and per capita income in the United States with a correlation coefficient (R) of -0.136 and weighted average of $45,605, a difference of 16.7%.
Per Capita Income Correlation Summary
| Measurement | Belizean | Jordanian |
| Minimum | $18,752 | $22,143 |
| Maximum | $55,551 | $70,697 |
| Range | $36,799 | $48,554 |
| Mean | $34,798 | $43,077 |
| Median | $34,873 | $42,576 |
| Interquartile 25% (IQ1) | $30,514 | $35,594 |
| Interquartile 75% (IQ3) | $40,555 | $50,277 |
| Interquartile Range (IQR) | $10,041 | $14,683 |
| Standard Deviation (Sample) | $7,514 | $10,214 |
| Standard Deviation (Population) | $7,444 | $10,105 |
Similar Demographics by Per Capita Income
Demographics Similar to Belizeans by Per Capita Income
In terms of per capita income, the demographic groups most similar to Belizeans are Iroquois ($39,104, a difference of 0.020%), Marshallese ($39,108, a difference of 0.030%), American ($39,039, a difference of 0.15%), Alaskan Athabascan ($39,163, a difference of 0.17%), and Spanish American ($39,012, a difference of 0.22%).
| Demographics | Rating | Rank | Per Capita Income |
| Hawaiians | 0.8 /100 | #256 | Tragic $39,403 |
| Nicaraguans | 0.8 /100 | #257 | Tragic $39,372 |
| Jamaicans | 0.7 /100 | #258 | Tragic $39,231 |
| Malaysians | 0.7 /100 | #259 | Tragic $39,194 |
| Alaskan Athabascans | 0.6 /100 | #260 | Tragic $39,163 |
| Marshallese | 0.6 /100 | #261 | Tragic $39,108 |
| Iroquois | 0.6 /100 | #262 | Tragic $39,104 |
| Belizeans | 0.6 /100 | #263 | Tragic $39,097 |
| Americans | 0.6 /100 | #264 | Tragic $39,039 |
| Spanish Americans | 0.5 /100 | #265 | Tragic $39,012 |
| Salvadorans | 0.5 /100 | #266 | Tragic $38,858 |
| Immigrants | Zaire | 0.4 /100 | #267 | Tragic $38,848 |
| Liberians | 0.4 /100 | #268 | Tragic $38,780 |
| Immigrants | Jamaica | 0.4 /100 | #269 | Tragic $38,766 |
| Immigrants | Belize | 0.3 /100 | #270 | Tragic $38,614 |
Demographics Similar to Jordanians by Per Capita Income
In terms of per capita income, the demographic groups most similar to Jordanians are Immigrants from North Macedonia ($45,622, a difference of 0.040%), Pakistani ($45,587, a difference of 0.040%), Slovene ($45,581, a difference of 0.050%), Arab ($45,662, a difference of 0.12%), and Luxembourger ($45,663, a difference of 0.13%).
| Demographics | Rating | Rank | Per Capita Income |
| Zimbabweans | 91.7 /100 | #125 | Exceptional $45,804 |
| Palestinians | 91.6 /100 | #126 | Exceptional $45,790 |
| Immigrants | Germany | 91.3 /100 | #127 | Exceptional $45,751 |
| Swedes | 91.3 /100 | #128 | Exceptional $45,750 |
| Luxembourgers | 90.4 /100 | #129 | Exceptional $45,663 |
| Arabs | 90.4 /100 | #130 | Exceptional $45,662 |
| Immigrants | North Macedonia | 90.0 /100 | #131 | Exceptional $45,622 |
| Jordanians | 89.9 /100 | #132 | Excellent $45,605 |
| Pakistanis | 89.7 /100 | #133 | Excellent $45,587 |
| Slovenes | 89.6 /100 | #134 | Excellent $45,581 |
| Hungarians | 87.9 /100 | #135 | Excellent $45,426 |
| Immigrants | Oceania | 85.2 /100 | #136 | Excellent $45,220 |
| Immigrants | Syria | 85.2 /100 | #137 | Excellent $45,218 |
| Assyrians/Chaldeans/Syriacs | 84.8 /100 | #138 | Excellent $45,195 |
| Basques | 83.2 /100 | #139 | Excellent $45,086 |