Filipino vs Immigrants from England Per Capita Income

COMPARE

Filipino
Race
Ancestry
AfghanAfricanAlaska NativeAlaskan AthabascanAlbanianAleutAlsatianAmericanApacheArabArapahoArgentineanArmenianAssyrian/Chaldean/SyriacAustralianAustrianBahamianBangladeshiBarbadianBasqueBelgianBelizeanBermudanBhutaneseBlackfeetBolivianBrazilianBritishBritish West IndianBulgarianBurmeseCajunCambodianCanadianCape VerdeanCarpatho RusynCelticCentral AmericanCentral American IndianCherokeeCheyenneChickasawChileanChineseChippewaChoctawColombianColvilleComancheCosta RicanCreeCreekCroatianCrowCubanCypriotCzechCzechoslovakianDanishDelawareDominicanDutchDutch West IndianEastern EuropeanEcuadorianEgyptianEnglishEstonianEthiopianEuropeanFijianFilipinoFinnishFrenchFrench American IndianFrench CanadianGermanGerman RussianGhanaianGreekGuamanian/ChamorroGuatemalanGuyaneseHaitianHmongHonduranHopiHoumaHungarianIcelanderIndian (Asian)IndonesianInupiatIranianIraqiIrishIroquoisIsraeliItalianJamaicanJapaneseJordanianKenyanKiowaKoreanLaotianLatvianLebaneseLiberianLithuanianLumbeeLuxembourgerMacedonianMalaysianMalteseMarshalleseMenomineeMexicanMexican American IndianMongolianMoroccanNative HawaiianNavajoNepaleseNew ZealanderNicaraguanNigerianNorthern EuropeanNorwegianOkinawanOsageOttawaPaiutePakistaniPalestinianPanamanianParaguayanPennsylvania GermanPeruvianPimaPolishPortuguesePotawatomiPuebloPuerto RicanPuget Sound SalishRomanianRussianSalvadoranSamoanScandinavianScotch-IrishScottishSeminoleSenegaleseSerbianShoshoneSierra LeoneanSiouxSlavicSlovakSloveneSomaliSouth AfricanSouth AmericanSouth American IndianSoviet UnionSpaniardSpanishSpanish AmericanSpanish American IndianSri LankanSubsaharan AfricanSudaneseSwedishSwissSyrianTaiwaneseThaiTlingit-HaidaTohono O'OdhamTonganTrinidadian and TobagonianTsimshianTurkishU.S. Virgin IslanderUgandanUkrainianUruguayanUteVenezuelanVietnameseWelshWest IndianYakamaYaquiYugoslavianYumanYup'ikZimbabwean
Immigration
NonimmigrantsImmigrantsAfghanistanAfricaAlbaniaArgentinaArmeniaAsiaAustraliaAustriaBahamasBangladeshBarbadosBelarusBelgiumBelizeBoliviaBosnia and HerzegovinaBrazilBulgariaBurma/MyanmarCabo VerdeCambodiaCameroonCanadaCaribbeanCentral AmericaChileChinaColombiaCongoCosta RicaCroatiaCubaCzechoslovakiaDenmarkDominicaDominican RepublicEastern AfricaEastern AsiaEastern EuropeEcuadorEgyptEl SalvadorEritreaEthiopiaEuropeFijiFranceGermanyGhanaGreeceGrenadaGuatemalaGuyanaHaitiHondurasHong KongHungaryIndiaIndonesiaIranIraqIrelandIsraelItalyJamaicaJapanJordanKazakhstanKenyaKoreaKuwaitLaosLatin AmericaLatviaLebanonLiberiaLithuaniaMalaysiaMexicoMicronesiaMiddle AfricaMoldovaMoroccoNepalNetherlandsNicaraguaNigeriaNorth AmericaNorth MacedoniaNorthern AfricaNorthern EuropeNorwayOceaniaPakistanPanamaPeruPhilippinesPolandPortugalRomaniaRussiaSaudi ArabiaScotlandSenegalSerbiaSierra LeoneSingaporeSomaliaSouth AfricaSouth AmericaSouth Central AsiaSouth Eastern AsiaSouthern EuropeSpainSri LankaSt. Vincent and the GrenadinesSudanSwedenSwitzerlandSyriaTaiwanThailandTrinidad and TobagoTurkeyUgandaUkraineUruguayUzbekistanVenezuelaVietnamWest IndiesWestern AfricaWestern AsiaWestern EuropeYemenZaireZimbabweAzores
Immigrants from England
Race
Ancestry
AfghanAfricanAlaska NativeAlaskan AthabascanAlbanianAleutAlsatianAmericanApacheArabArapahoArgentineanArmenianAssyrian/Chaldean/SyriacAustralianAustrianBahamianBangladeshiBarbadianBasqueBelgianBelizeanBermudanBhutaneseBlackfeetBolivianBrazilianBritishBritish West IndianBulgarianBurmeseCajunCambodianCanadianCape VerdeanCarpatho RusynCelticCentral AmericanCentral American IndianCherokeeCheyenneChickasawChileanChineseChippewaChoctawColombianColvilleComancheCosta RicanCreeCreekCroatianCrowCubanCypriotCzechCzechoslovakianDanishDelawareDominicanDutchDutch West IndianEastern EuropeanEcuadorianEgyptianEnglishEstonianEthiopianEuropeanFijianFinnishFrenchFrench American IndianFrench CanadianGermanGerman RussianGhanaianGreekGuamanian/ChamorroGuatemalanGuyaneseHaitianHmongHonduranHopiHoumaHungarianIcelanderIndian (Asian)IndonesianInupiatIranianIraqiIrishIroquoisIsraeliItalianJamaicanJapaneseJordanianKenyanKiowaKoreanLaotianLatvianLebaneseLiberianLithuanianLumbeeLuxembourgerMacedonianMalaysianMalteseMarshalleseMenomineeMexicanMexican American IndianMongolianMoroccanNative HawaiianNavajoNepaleseNew ZealanderNicaraguanNigerianNorthern EuropeanNorwegianOkinawanOsageOttawaPaiutePakistaniPalestinianPanamanianParaguayanPennsylvania GermanPeruvianPimaPolishPortuguesePotawatomiPuebloPuerto RicanPuget Sound SalishRomanianRussianSalvadoranSamoanScandinavianScotch-IrishScottishSeminoleSenegaleseSerbianShoshoneSierra LeoneanSiouxSlavicSlovakSloveneSomaliSouth AfricanSouth AmericanSouth American IndianSoviet UnionSpaniardSpanishSpanish AmericanSpanish American IndianSri LankanSubsaharan AfricanSudaneseSwedishSwissSyrianTaiwaneseThaiTlingit-HaidaTohono O'OdhamTonganTrinidadian and TobagonianTsimshianTurkishU.S. Virgin IslanderUgandanUkrainianUruguayanUteVenezuelanVietnameseWelshWest IndianYakamaYaquiYugoslavianYumanYup'ikZimbabwean
Immigration
NonimmigrantsImmigrantsAfghanistanAfricaAlbaniaArgentinaArmeniaAsiaAustraliaAustriaBahamasBangladeshBarbadosBelarusBelgiumBelizeBoliviaBosnia and HerzegovinaBrazilBulgariaBurma/MyanmarCabo VerdeCambodiaCameroonCanadaCaribbeanCentral AmericaChileChinaColombiaCongoCosta RicaCroatiaCubaCzechoslovakiaDenmarkDominicaDominican RepublicEastern AfricaEastern AsiaEastern EuropeEcuadorEgyptEl SalvadorEnglandEritreaEthiopiaEuropeFijiFranceGermanyGhanaGreeceGrenadaGuatemalaGuyanaHaitiHondurasHong KongHungaryIndiaIndonesiaIranIraqIrelandIsraelItalyJamaicaJapanJordanKazakhstanKenyaKoreaKuwaitLaosLatin AmericaLatviaLebanonLiberiaLithuaniaMalaysiaMexicoMicronesiaMiddle AfricaMoldovaMoroccoNepalNetherlandsNicaraguaNigeriaNorth AmericaNorth MacedoniaNorthern AfricaNorthern EuropeNorwayOceaniaPakistanPanamaPeruPhilippinesPolandPortugalRomaniaRussiaSaudi ArabiaScotlandSenegalSerbiaSierra LeoneSingaporeSomaliaSouth AfricaSouth AmericaSouth Central AsiaSouth Eastern AsiaSouthern EuropeSpainSri LankaSt. Vincent and the GrenadinesSudanSwedenSwitzerlandSyriaTaiwanThailandTrinidad and TobagoTurkeyUgandaUkraineUruguayUzbekistanVenezuelaVietnamWest IndiesWestern AfricaWestern AsiaWestern EuropeYemenZaireZimbabweAzores
Per Capita Income
Income
Poverty
Unemployment
Labor Participation
Family Structure
Vehicle Availability
Education Level
Disability

Per Capita Income Comparison

Filipinos

Immigrants from England

Exceptional
Exceptional
$59,066
PER CAPITA INCOME
100.0/ 100
METRIC RATING
1st/ 347
METRIC RANK
$48,844
PER CAPITA INCOME
99.7/ 100
METRIC RATING
76th/ 347
METRIC RANK

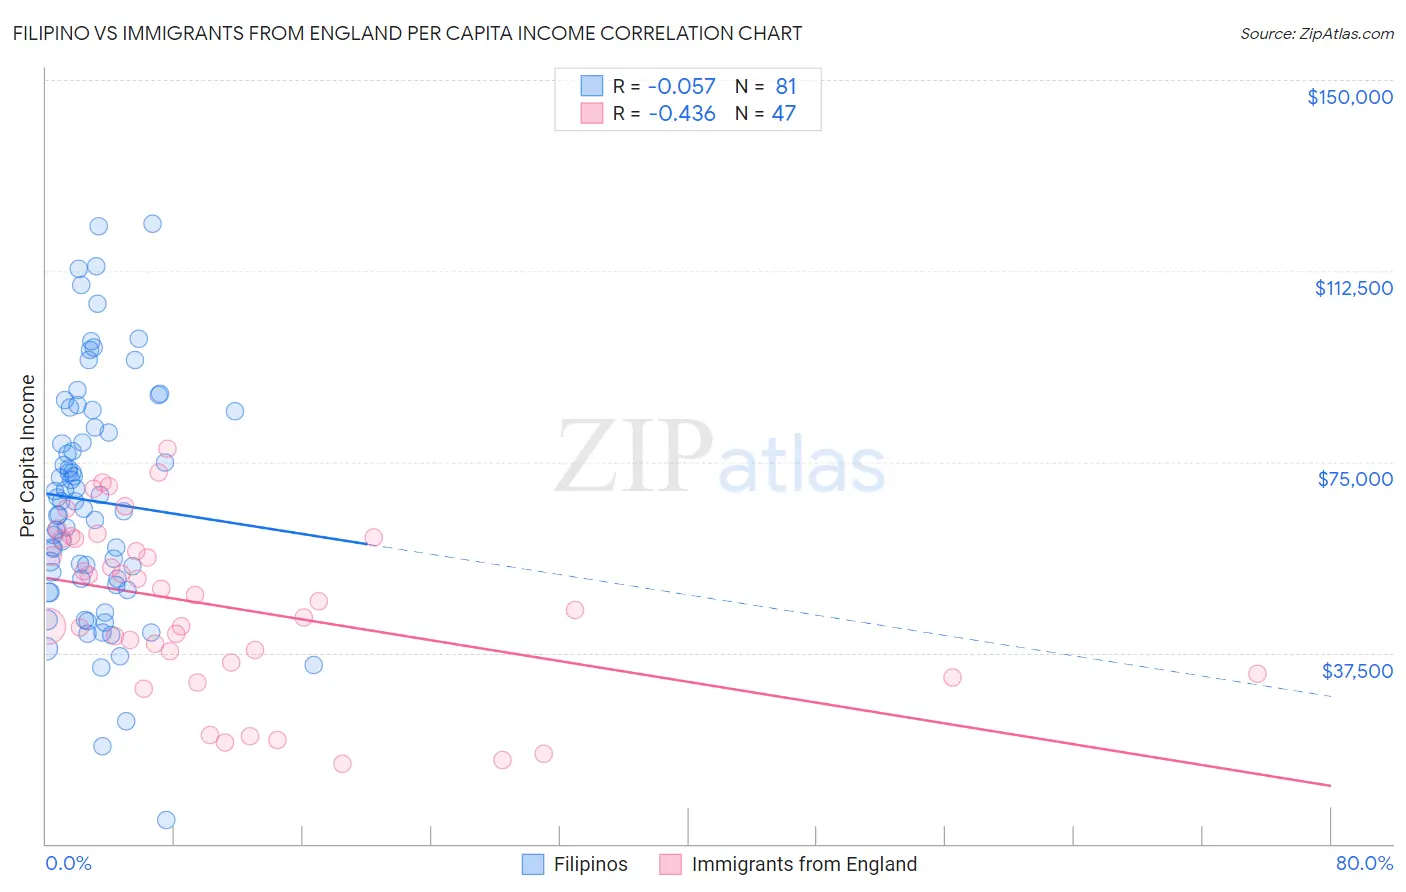
Filipino vs Immigrants from England Per Capita Income Correlation Chart

The statistical analysis conducted on geographies consisting of 254,359,894 people shows a slight negative correlation between the proportion of Filipinos and per capita income in the United States with a correlation coefficient (R) of -0.057 and weighted average of $59,066. Similarly, the statistical analysis conducted on geographies consisting of 391,908,238 people shows a moderate negative correlation between the proportion of Immigrants from England and per capita income in the United States with a correlation coefficient (R) of -0.436 and weighted average of $48,844, a difference of 20.9%.
Filipino vs Immigrants from England Per Capita Income

Per Capita Income Correlation Summary

MeasurementFilipinoImmigrants from England
Minimum$4,657$15,716
Maximum$121,798$77,696
Range$117,141$61,980
Mean$67,314$46,607
Median$67,249$47,511
Interquartile 25% (IQ1)$51,364$35,676
Interquartile 75% (IQ3)$83,421$59,917
Interquartile Range (IQR)$32,057$24,241
Standard Deviation (Sample)$23,294$16,522
Standard Deviation (Population)$23,149$16,346

Similar Demographics by Per Capita Income

Demographics Similar to Filipinos by Per Capita Income

In terms of per capita income, the demographic groups most similar to Filipinos are Iranian ($58,786, a difference of 0.48%), Immigrants from Singapore ($58,353, a difference of 1.2%), Immigrants from Australia ($57,953, a difference of 1.9%), Immigrants from Iran ($57,759, a difference of 2.3%), and Immigrants from Taiwan ($57,742, a difference of 2.3%).
DemographicsRating | RankPer Capita Income
Filipinos
100.0
/100
|
#1
Exceptional
$59,066
Iranians
100.0
/100
|
#2
Exceptional
$58,786
Immigrants | Singapore
100.0
/100
|
#3
Exceptional
$58,353
Immigrants | Australia
100.0
/100
|
#4
Exceptional
$57,953
Immigrants | Iran
100.0
/100
|
#5
Exceptional
$57,759
Immigrants | Taiwan
100.0
/100
|
#6
Exceptional
$57,742
Immigrants | Israel
100.0
/100
|
#7
Exceptional
$57,384
Immigrants | Hong Kong
100.0
/100
|
#8
Exceptional
$56,709
Immigrants | Ireland
100.0
/100
|
#9
Exceptional
$56,584
Okinawans
100.0
/100
|
#10
Exceptional
$55,817
Eastern Europeans
100.0
/100
|
#11
Exceptional
$55,780
Immigrants | Sweden
100.0
/100
|
#12
Exceptional
$55,582
Immigrants | India
100.0
/100
|
#13
Exceptional
$55,268
Immigrants | Belgium
100.0
/100
|
#14
Exceptional
$55,082
Cypriots
100.0
/100
|
#15
Exceptional
$54,899

Demographics Similar to Immigrants from England by Per Capita Income

In terms of per capita income, the demographic groups most similar to Immigrants from England are Immigrants from Kazakhstan ($48,747, a difference of 0.20%), Immigrants from Bolivia ($48,970, a difference of 0.26%), Immigrants from Italy ($48,654, a difference of 0.39%), Mongolian ($49,173, a difference of 0.67%), and Romanian ($48,445, a difference of 0.82%).
DemographicsRating | RankPer Capita Income
Immigrants | Canada
99.8
/100
|
#69
Exceptional
$49,412
Immigrants | Eastern Europe
99.8
/100
|
#70
Exceptional
$49,316
Greeks
99.8
/100
|
#71
Exceptional
$49,309
Immigrants | Hungary
99.8
/100
|
#72
Exceptional
$49,303
Immigrants | North America
99.8
/100
|
#73
Exceptional
$49,302
Mongolians
99.8
/100
|
#74
Exceptional
$49,173
Immigrants | Bolivia
99.7
/100
|
#75
Exceptional
$48,970
Immigrants | England
99.7
/100
|
#76
Exceptional
$48,844
Immigrants | Kazakhstan
99.7
/100
|
#77
Exceptional
$48,747
Immigrants | Italy
99.6
/100
|
#78
Exceptional
$48,654
Romanians
99.5
/100
|
#79
Exceptional
$48,445
Egyptians
99.5
/100
|
#80
Exceptional
$48,358
Armenians
99.4
/100
|
#81
Exceptional
$48,287
Immigrants | Indonesia
99.4
/100
|
#82
Exceptional
$48,195
Immigrants | Brazil
99.4
/100
|
#83
Exceptional
$48,164