Filipino vs Brazilian Per Capita Income
COMPARE
Filipino
Brazilian
Per Capita Income
Per Capita Income Comparison
Filipinos
Brazilians
$59,066
PER CAPITA INCOME
100.0/ 100
METRIC RATING
1st/ 347
METRIC RANK
$46,700
PER CAPITA INCOME
96.8/ 100
METRIC RATING
104th/ 347
METRIC RANK
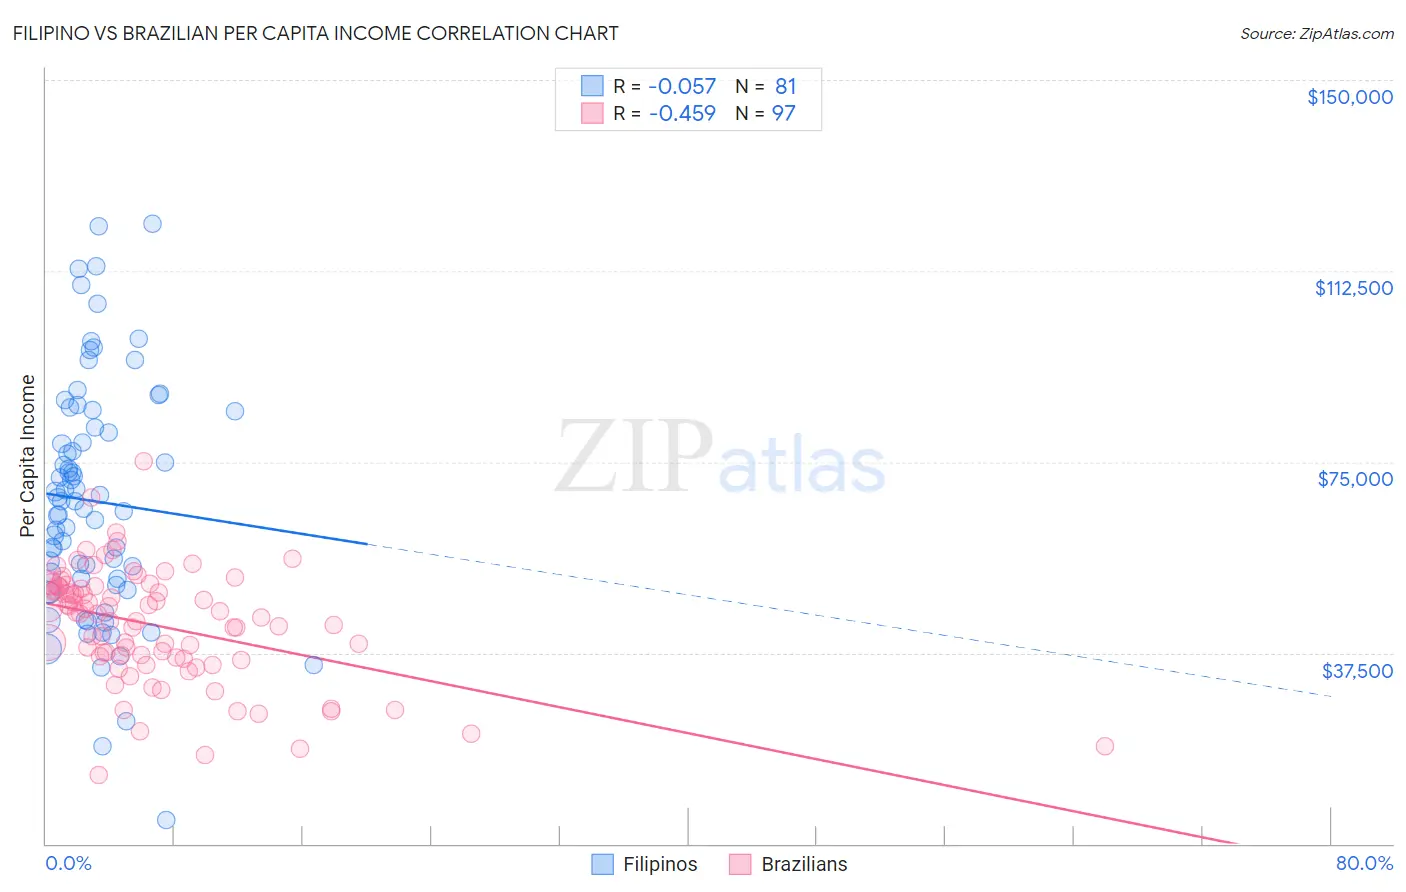
Filipino vs Brazilian Per Capita Income Correlation Chart
The statistical analysis conducted on geographies consisting of 254,359,894 people shows a slight negative correlation between the proportion of Filipinos and per capita income in the United States with a correlation coefficient (R) of -0.057 and weighted average of $59,066. Similarly, the statistical analysis conducted on geographies consisting of 323,990,504 people shows a moderate negative correlation between the proportion of Brazilians and per capita income in the United States with a correlation coefficient (R) of -0.459 and weighted average of $46,700, a difference of 26.5%.
Per Capita Income Correlation Summary
| Measurement | Filipino | Brazilian |
| Minimum | $4,657 | $13,624 |
| Maximum | $121,798 | $75,068 |
| Range | $117,141 | $61,444 |
| Mean | $67,314 | $42,865 |
| Median | $67,249 | $45,205 |
| Interquartile 25% (IQ1) | $51,364 | $36,434 |
| Interquartile 75% (IQ3) | $83,421 | $50,401 |
| Interquartile Range (IQR) | $32,057 | $13,966 |
| Standard Deviation (Sample) | $23,294 | $11,177 |
| Standard Deviation (Population) | $23,149 | $11,120 |
Similar Demographics by Per Capita Income
Demographics Similar to Filipinos by Per Capita Income
In terms of per capita income, the demographic groups most similar to Filipinos are Iranian ($58,786, a difference of 0.48%), Immigrants from Singapore ($58,353, a difference of 1.2%), Immigrants from Australia ($57,953, a difference of 1.9%), Immigrants from Iran ($57,759, a difference of 2.3%), and Immigrants from Taiwan ($57,742, a difference of 2.3%).
| Demographics | Rating | Rank | Per Capita Income |
| Filipinos | 100.0 /100 | #1 | Exceptional $59,066 |
| Iranians | 100.0 /100 | #2 | Exceptional $58,786 |
| Immigrants | Singapore | 100.0 /100 | #3 | Exceptional $58,353 |
| Immigrants | Australia | 100.0 /100 | #4 | Exceptional $57,953 |
| Immigrants | Iran | 100.0 /100 | #5 | Exceptional $57,759 |
| Immigrants | Taiwan | 100.0 /100 | #6 | Exceptional $57,742 |
| Immigrants | Israel | 100.0 /100 | #7 | Exceptional $57,384 |
| Immigrants | Hong Kong | 100.0 /100 | #8 | Exceptional $56,709 |
| Immigrants | Ireland | 100.0 /100 | #9 | Exceptional $56,584 |
| Okinawans | 100.0 /100 | #10 | Exceptional $55,817 |
| Eastern Europeans | 100.0 /100 | #11 | Exceptional $55,780 |
| Immigrants | Sweden | 100.0 /100 | #12 | Exceptional $55,582 |
| Immigrants | India | 100.0 /100 | #13 | Exceptional $55,268 |
| Immigrants | Belgium | 100.0 /100 | #14 | Exceptional $55,082 |
| Cypriots | 100.0 /100 | #15 | Exceptional $54,899 |
Demographics Similar to Brazilians by Per Capita Income
In terms of per capita income, the demographic groups most similar to Brazilians are British ($46,571, a difference of 0.28%), Ethiopian ($46,569, a difference of 0.28%), Syrian ($46,837, a difference of 0.29%), Serbian ($46,551, a difference of 0.32%), and Immigrants from Kuwait ($46,543, a difference of 0.34%).
| Demographics | Rating | Rank | Per Capita Income |
| Carpatho Rusyns | 98.2 /100 | #97 | Exceptional $47,248 |
| Immigrants | Pakistan | 97.9 /100 | #98 | Exceptional $47,084 |
| Laotians | 97.8 /100 | #99 | Exceptional $47,041 |
| Immigrants | Lebanon | 97.5 /100 | #100 | Exceptional $46,938 |
| Immigrants | Uzbekistan | 97.5 /100 | #101 | Exceptional $46,929 |
| Immigrants | Western Asia | 97.4 /100 | #102 | Exceptional $46,876 |
| Syrians | 97.2 /100 | #103 | Exceptional $46,837 |
| Brazilians | 96.8 /100 | #104 | Exceptional $46,700 |
| British | 96.3 /100 | #105 | Exceptional $46,571 |
| Ethiopians | 96.3 /100 | #106 | Exceptional $46,569 |
| Serbians | 96.2 /100 | #107 | Exceptional $46,551 |
| Immigrants | Kuwait | 96.2 /100 | #108 | Exceptional $46,543 |
| Immigrants | Northern Africa | 96.2 /100 | #109 | Exceptional $46,531 |
| Chileans | 95.9 /100 | #110 | Exceptional $46,459 |
| Taiwanese | 95.8 /100 | #111 | Exceptional $46,455 |