Crow vs Jordanian Per Capita Income
COMPARE
Crow
Jordanian
Per Capita Income
Per Capita Income Comparison
Crow
Jordanians
$31,729
PER CAPITA INCOME
0.0/ 100
METRIC RATING
340th/ 347
METRIC RANK
$45,605
PER CAPITA INCOME
89.9/ 100
METRIC RATING
132nd/ 347
METRIC RANK
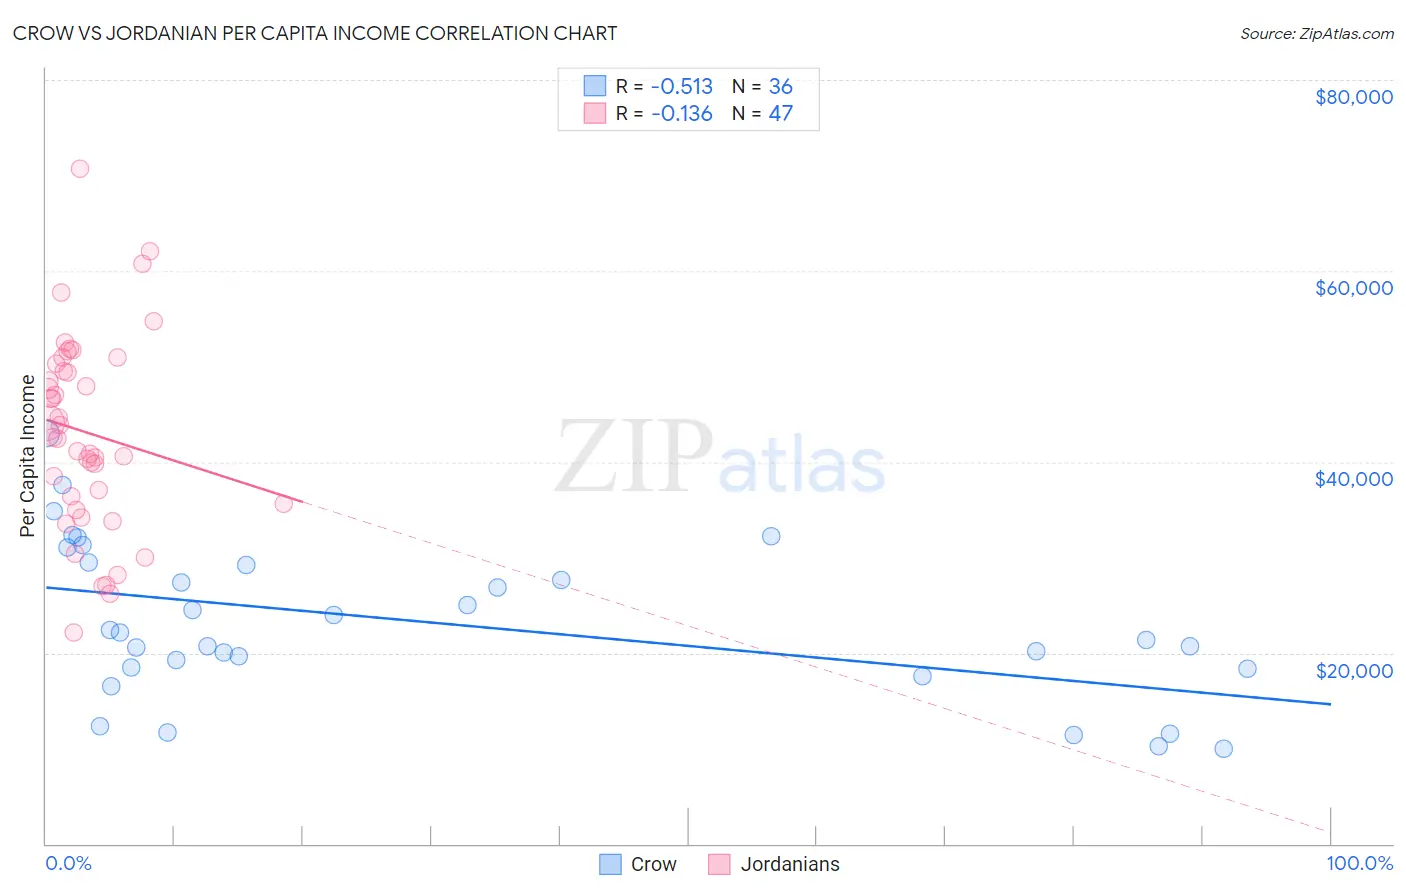
Crow vs Jordanian Per Capita Income Correlation Chart
The statistical analysis conducted on geographies consisting of 59,209,980 people shows a substantial negative correlation between the proportion of Crow and per capita income in the United States with a correlation coefficient (R) of -0.513 and weighted average of $31,729. Similarly, the statistical analysis conducted on geographies consisting of 166,389,755 people shows a poor negative correlation between the proportion of Jordanians and per capita income in the United States with a correlation coefficient (R) of -0.136 and weighted average of $45,605, a difference of 43.7%.
Per Capita Income Correlation Summary
| Measurement | Crow | Jordanian |
| Minimum | $9,914 | $22,143 |
| Maximum | $42,917 | $70,697 |
| Range | $33,003 | $48,554 |
| Mean | $23,129 | $43,077 |
| Median | $21,705 | $42,576 |
| Interquartile 25% (IQ1) | $18,390 | $35,594 |
| Interquartile 75% (IQ3) | $29,346 | $50,277 |
| Interquartile Range (IQR) | $10,956 | $14,683 |
| Standard Deviation (Sample) | $8,112 | $10,214 |
| Standard Deviation (Population) | $7,999 | $10,105 |
Similar Demographics by Per Capita Income
Demographics Similar to Crow by Per Capita Income
In terms of per capita income, the demographic groups most similar to Crow are Pueblo ($32,012, a difference of 0.89%), Puerto Rican ($31,268, a difference of 1.5%), Hopi ($31,177, a difference of 1.8%), Arapaho ($32,345, a difference of 1.9%), and Pima ($30,644, a difference of 3.5%).
| Demographics | Rating | Rank | Per Capita Income |
| Immigrants | Yemen | 0.0 /100 | #333 | Tragic $33,696 |
| Natives/Alaskans | 0.0 /100 | #334 | Tragic $33,279 |
| Yuman | 0.0 /100 | #335 | Tragic $33,236 |
| Yakama | 0.0 /100 | #336 | Tragic $33,009 |
| Houma | 0.0 /100 | #337 | Tragic $32,996 |
| Arapaho | 0.0 /100 | #338 | Tragic $32,345 |
| Pueblo | 0.0 /100 | #339 | Tragic $32,012 |
| Crow | 0.0 /100 | #340 | Tragic $31,729 |
| Puerto Ricans | 0.0 /100 | #341 | Tragic $31,268 |
| Hopi | 0.0 /100 | #342 | Tragic $31,177 |
| Pima | 0.0 /100 | #343 | Tragic $30,644 |
| Yup'ik | 0.0 /100 | #344 | Tragic $30,518 |
| Tohono O'odham | 0.0 /100 | #345 | Tragic $30,256 |
| Lumbee | 0.0 /100 | #346 | Tragic $29,845 |
| Navajo | 0.0 /100 | #347 | Tragic $29,031 |
Demographics Similar to Jordanians by Per Capita Income
In terms of per capita income, the demographic groups most similar to Jordanians are Immigrants from North Macedonia ($45,622, a difference of 0.040%), Pakistani ($45,587, a difference of 0.040%), Slovene ($45,581, a difference of 0.050%), Arab ($45,662, a difference of 0.12%), and Luxembourger ($45,663, a difference of 0.13%).
| Demographics | Rating | Rank | Per Capita Income |
| Zimbabweans | 91.7 /100 | #125 | Exceptional $45,804 |
| Palestinians | 91.6 /100 | #126 | Exceptional $45,790 |
| Immigrants | Germany | 91.3 /100 | #127 | Exceptional $45,751 |
| Swedes | 91.3 /100 | #128 | Exceptional $45,750 |
| Luxembourgers | 90.4 /100 | #129 | Exceptional $45,663 |
| Arabs | 90.4 /100 | #130 | Exceptional $45,662 |
| Immigrants | North Macedonia | 90.0 /100 | #131 | Exceptional $45,622 |
| Jordanians | 89.9 /100 | #132 | Excellent $45,605 |
| Pakistanis | 89.7 /100 | #133 | Excellent $45,587 |
| Slovenes | 89.6 /100 | #134 | Excellent $45,581 |
| Hungarians | 87.9 /100 | #135 | Excellent $45,426 |
| Immigrants | Oceania | 85.2 /100 | #136 | Excellent $45,220 |
| Immigrants | Syria | 85.2 /100 | #137 | Excellent $45,218 |
| Assyrians/Chaldeans/Syriacs | 84.8 /100 | #138 | Excellent $45,195 |
| Basques | 83.2 /100 | #139 | Excellent $45,086 |