Polish vs Immigrants from England Per Capita Income
COMPARE
Polish
Immigrants from England
Per Capita Income
Per Capita Income Comparison
Poles
Immigrants from England
$46,123
PER CAPITA INCOME
94.1/ 100
METRIC RATING
116th/ 347
METRIC RANK
$48,844
PER CAPITA INCOME
99.7/ 100
METRIC RATING
76th/ 347
METRIC RANK
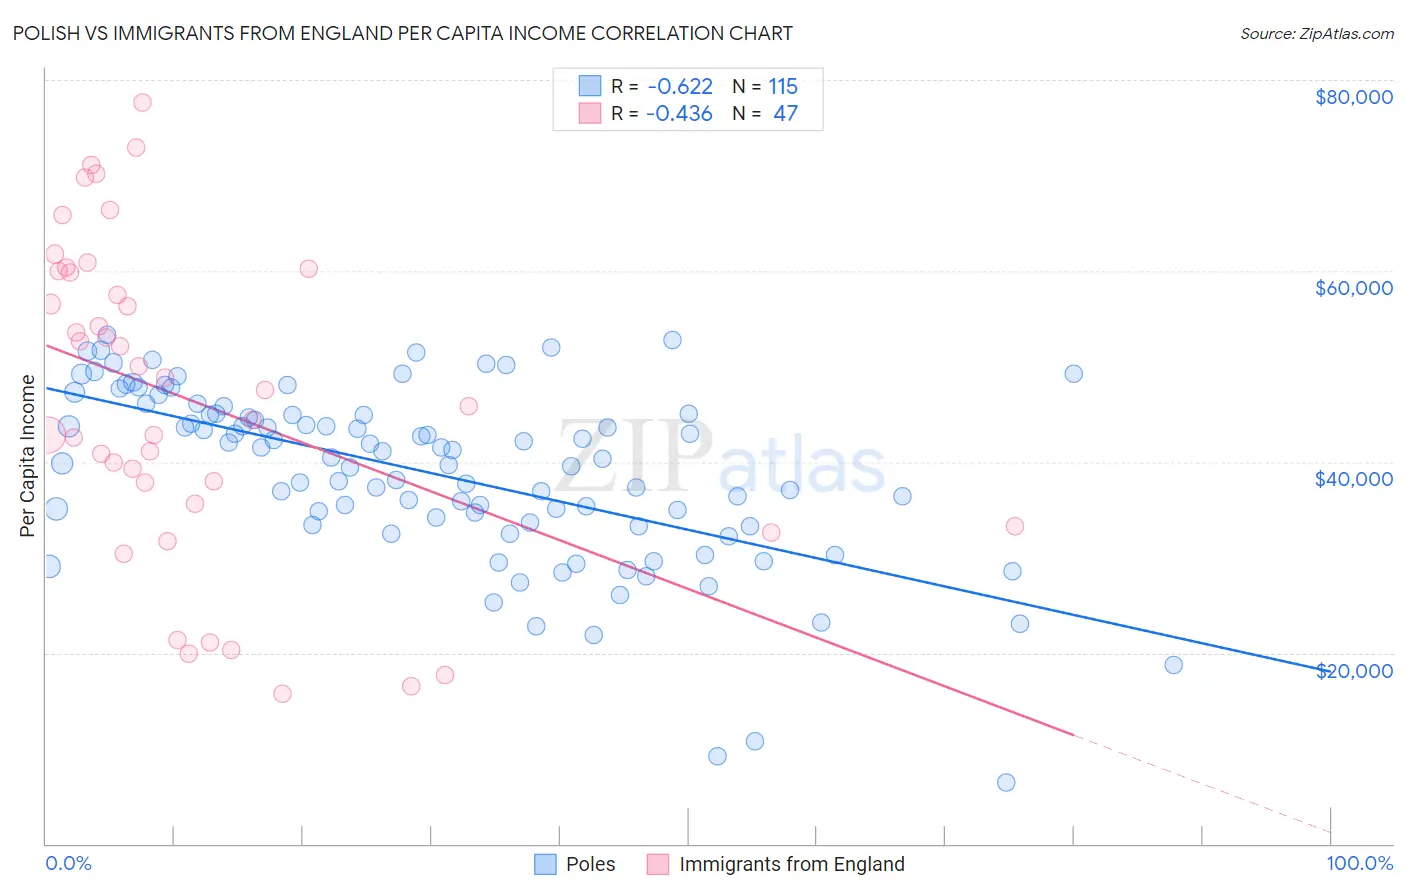
Polish vs Immigrants from England Per Capita Income Correlation Chart
The statistical analysis conducted on geographies consisting of 560,657,396 people shows a significant negative correlation between the proportion of Poles and per capita income in the United States with a correlation coefficient (R) of -0.622 and weighted average of $46,123. Similarly, the statistical analysis conducted on geographies consisting of 391,908,238 people shows a moderate negative correlation between the proportion of Immigrants from England and per capita income in the United States with a correlation coefficient (R) of -0.436 and weighted average of $48,844, a difference of 5.9%.
Per Capita Income Correlation Summary
| Measurement | Polish | Immigrants from England |
| Minimum | $6,461 | $15,716 |
| Maximum | $53,317 | $77,696 |
| Range | $46,856 | $61,980 |
| Mean | $38,750 | $46,607 |
| Median | $40,450 | $47,511 |
| Interquartile 25% (IQ1) | $33,437 | $35,676 |
| Interquartile 75% (IQ3) | $44,990 | $59,917 |
| Interquartile Range (IQR) | $11,553 | $24,241 |
| Standard Deviation (Sample) | $9,315 | $16,522 |
| Standard Deviation (Population) | $9,274 | $16,346 |
Similar Demographics by Per Capita Income
Demographics Similar to Poles by Per Capita Income
In terms of per capita income, the demographic groups most similar to Poles are Chinese ($46,098, a difference of 0.050%), Immigrants from Chile ($46,213, a difference of 0.20%), Immigrants from Saudi Arabia ($46,008, a difference of 0.25%), Immigrants from Poland ($45,979, a difference of 0.31%), and Afghan ($46,268, a difference of 0.32%).
| Demographics | Rating | Rank | Per Capita Income |
| Immigrants | Northern Africa | 96.2 /100 | #109 | Exceptional $46,531 |
| Chileans | 95.9 /100 | #110 | Exceptional $46,459 |
| Taiwanese | 95.8 /100 | #111 | Exceptional $46,455 |
| Immigrants | Morocco | 95.7 /100 | #112 | Exceptional $46,430 |
| Immigrants | Albania | 95.5 /100 | #113 | Exceptional $46,387 |
| Afghans | 94.9 /100 | #114 | Exceptional $46,268 |
| Immigrants | Chile | 94.6 /100 | #115 | Exceptional $46,213 |
| Poles | 94.1 /100 | #116 | Exceptional $46,123 |
| Chinese | 93.9 /100 | #117 | Exceptional $46,098 |
| Immigrants | Saudi Arabia | 93.3 /100 | #118 | Exceptional $46,008 |
| Immigrants | Poland | 93.1 /100 | #119 | Exceptional $45,979 |
| Immigrants | Ethiopia | 92.7 /100 | #120 | Exceptional $45,923 |
| Canadians | 92.2 /100 | #121 | Exceptional $45,858 |
| Moroccans | 92.1 /100 | #122 | Exceptional $45,854 |
| Lebanese | 92.0 /100 | #123 | Exceptional $45,840 |
Demographics Similar to Immigrants from England by Per Capita Income
In terms of per capita income, the demographic groups most similar to Immigrants from England are Immigrants from Kazakhstan ($48,747, a difference of 0.20%), Immigrants from Bolivia ($48,970, a difference of 0.26%), Immigrants from Italy ($48,654, a difference of 0.39%), Mongolian ($49,173, a difference of 0.67%), and Romanian ($48,445, a difference of 0.82%).
| Demographics | Rating | Rank | Per Capita Income |
| Immigrants | Canada | 99.8 /100 | #69 | Exceptional $49,412 |
| Immigrants | Eastern Europe | 99.8 /100 | #70 | Exceptional $49,316 |
| Greeks | 99.8 /100 | #71 | Exceptional $49,309 |
| Immigrants | Hungary | 99.8 /100 | #72 | Exceptional $49,303 |
| Immigrants | North America | 99.8 /100 | #73 | Exceptional $49,302 |
| Mongolians | 99.8 /100 | #74 | Exceptional $49,173 |
| Immigrants | Bolivia | 99.7 /100 | #75 | Exceptional $48,970 |
| Immigrants | England | 99.7 /100 | #76 | Exceptional $48,844 |
| Immigrants | Kazakhstan | 99.7 /100 | #77 | Exceptional $48,747 |
| Immigrants | Italy | 99.6 /100 | #78 | Exceptional $48,654 |
| Romanians | 99.5 /100 | #79 | Exceptional $48,445 |
| Egyptians | 99.5 /100 | #80 | Exceptional $48,358 |
| Armenians | 99.4 /100 | #81 | Exceptional $48,287 |
| Immigrants | Indonesia | 99.4 /100 | #82 | Exceptional $48,195 |
| Immigrants | Brazil | 99.4 /100 | #83 | Exceptional $48,164 |