Immigrants from Argentina vs Immigrants from England Per Capita Income
COMPARE
Immigrants from Argentina
Immigrants from England
Per Capita Income
Per Capita Income Comparison
Immigrants from Argentina
Immigrants from England
$49,627
PER CAPITA INCOME
99.9/ 100
METRIC RATING
64th/ 347
METRIC RANK
$48,844
PER CAPITA INCOME
99.7/ 100
METRIC RATING
76th/ 347
METRIC RANK
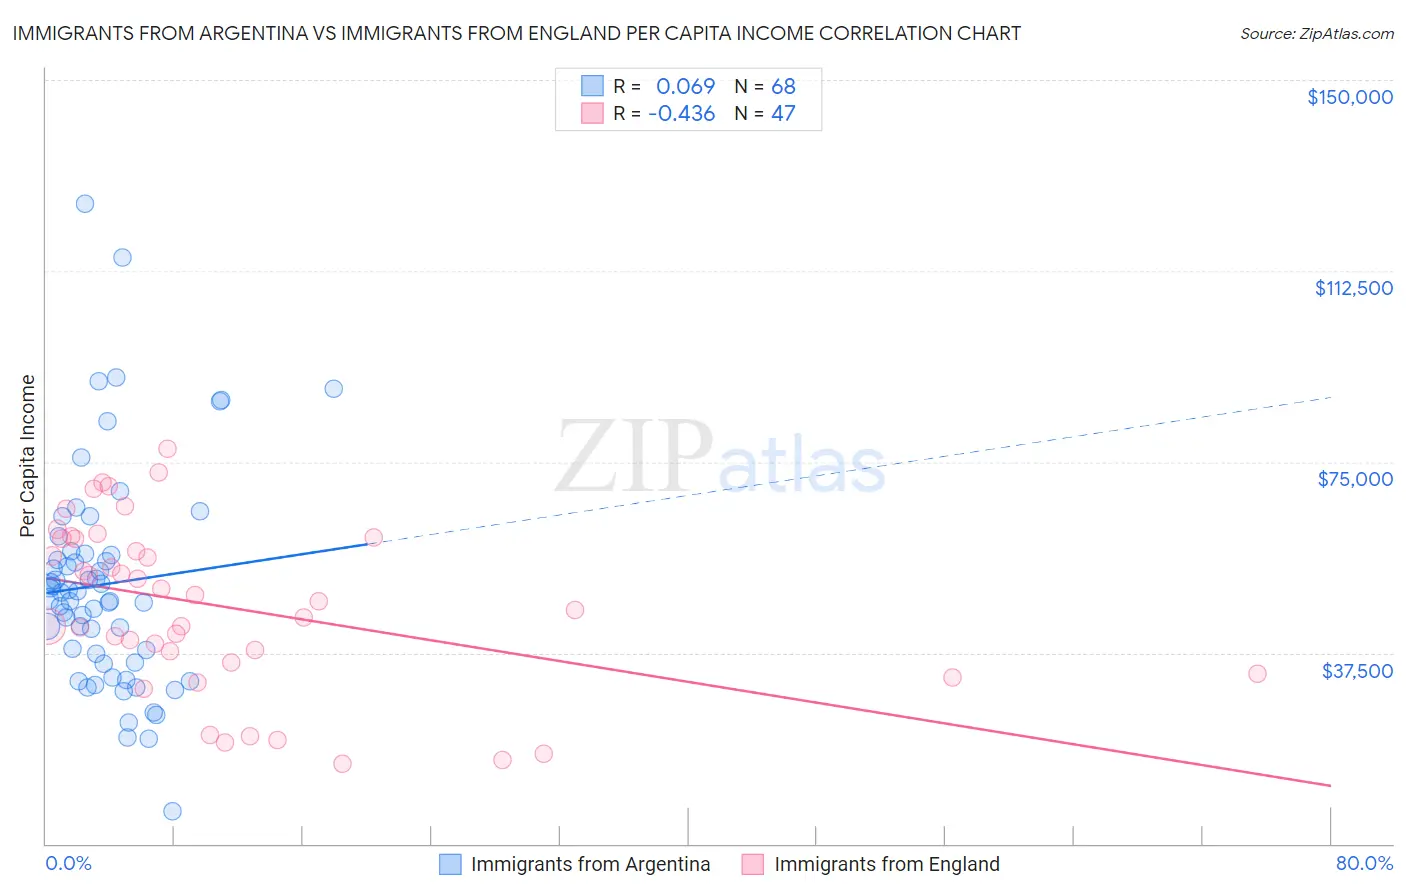
Immigrants from Argentina vs Immigrants from England Per Capita Income Correlation Chart
The statistical analysis conducted on geographies consisting of 264,438,412 people shows a slight positive correlation between the proportion of Immigrants from Argentina and per capita income in the United States with a correlation coefficient (R) of 0.069 and weighted average of $49,627. Similarly, the statistical analysis conducted on geographies consisting of 391,908,238 people shows a moderate negative correlation between the proportion of Immigrants from England and per capita income in the United States with a correlation coefficient (R) of -0.436 and weighted average of $48,844, a difference of 1.6%.
Per Capita Income Correlation Summary
| Measurement | Immigrants from Argentina | Immigrants from England |
| Minimum | $6,333 | $15,716 |
| Maximum | $125,688 | $77,696 |
| Range | $119,355 | $61,980 |
| Mean | $51,000 | $46,607 |
| Median | $48,720 | $47,511 |
| Interquartile 25% (IQ1) | $36,471 | $35,676 |
| Interquartile 75% (IQ3) | $56,811 | $59,917 |
| Interquartile Range (IQR) | $20,340 | $24,241 |
| Standard Deviation (Sample) | $21,495 | $16,522 |
| Standard Deviation (Population) | $21,336 | $16,346 |
Demographics Similar to Immigrants from Argentina and Immigrants from England by Per Capita Income
In terms of per capita income, the demographic groups most similar to Immigrants from Argentina are Maltese ($49,640, a difference of 0.030%), Bolivian ($49,526, a difference of 0.20%), Immigrants from Asia ($49,741, a difference of 0.23%), Immigrants from Bulgaria ($49,482, a difference of 0.29%), and Immigrants from Romania ($49,463, a difference of 0.33%). Similarly, the demographic groups most similar to Immigrants from England are Immigrants from Kazakhstan ($48,747, a difference of 0.20%), Immigrants from Bolivia ($48,970, a difference of 0.26%), Immigrants from Italy ($48,654, a difference of 0.39%), Mongolian ($49,173, a difference of 0.67%), and Romanian ($48,445, a difference of 0.82%).
| Demographics | Rating | Rank | Per Capita Income |
| Immigrants | Scotland | 99.9 /100 | #60 | Exceptional $49,893 |
| Argentineans | 99.9 /100 | #61 | Exceptional $49,862 |
| Immigrants | Asia | 99.9 /100 | #62 | Exceptional $49,741 |
| Maltese | 99.9 /100 | #63 | Exceptional $49,640 |
| Immigrants | Argentina | 99.9 /100 | #64 | Exceptional $49,627 |
| Bolivians | 99.9 /100 | #65 | Exceptional $49,526 |
| Immigrants | Bulgaria | 99.9 /100 | #66 | Exceptional $49,482 |
| Immigrants | Romania | 99.9 /100 | #67 | Exceptional $49,463 |
| Lithuanians | 99.8 /100 | #68 | Exceptional $49,448 |
| Immigrants | Canada | 99.8 /100 | #69 | Exceptional $49,412 |
| Immigrants | Eastern Europe | 99.8 /100 | #70 | Exceptional $49,316 |
| Greeks | 99.8 /100 | #71 | Exceptional $49,309 |
| Immigrants | Hungary | 99.8 /100 | #72 | Exceptional $49,303 |
| Immigrants | North America | 99.8 /100 | #73 | Exceptional $49,302 |
| Mongolians | 99.8 /100 | #74 | Exceptional $49,173 |
| Immigrants | Bolivia | 99.7 /100 | #75 | Exceptional $48,970 |
| Immigrants | England | 99.7 /100 | #76 | Exceptional $48,844 |
| Immigrants | Kazakhstan | 99.7 /100 | #77 | Exceptional $48,747 |
| Immigrants | Italy | 99.6 /100 | #78 | Exceptional $48,654 |
| Romanians | 99.5 /100 | #79 | Exceptional $48,445 |
| Egyptians | 99.5 /100 | #80 | Exceptional $48,358 |