Filipino vs Immigrants from Brazil 5th Grade
COMPARE
Filipino
Immigrants from Brazil
5th Grade
5th Grade Comparison
Filipinos
Immigrants from Brazil
97.5%
5TH GRADE
86.8/ 100
METRIC RATING
137th/ 347
METRIC RANK
97.3%
5TH GRADE
31.5/ 100
METRIC RATING
191st/ 347
METRIC RANK
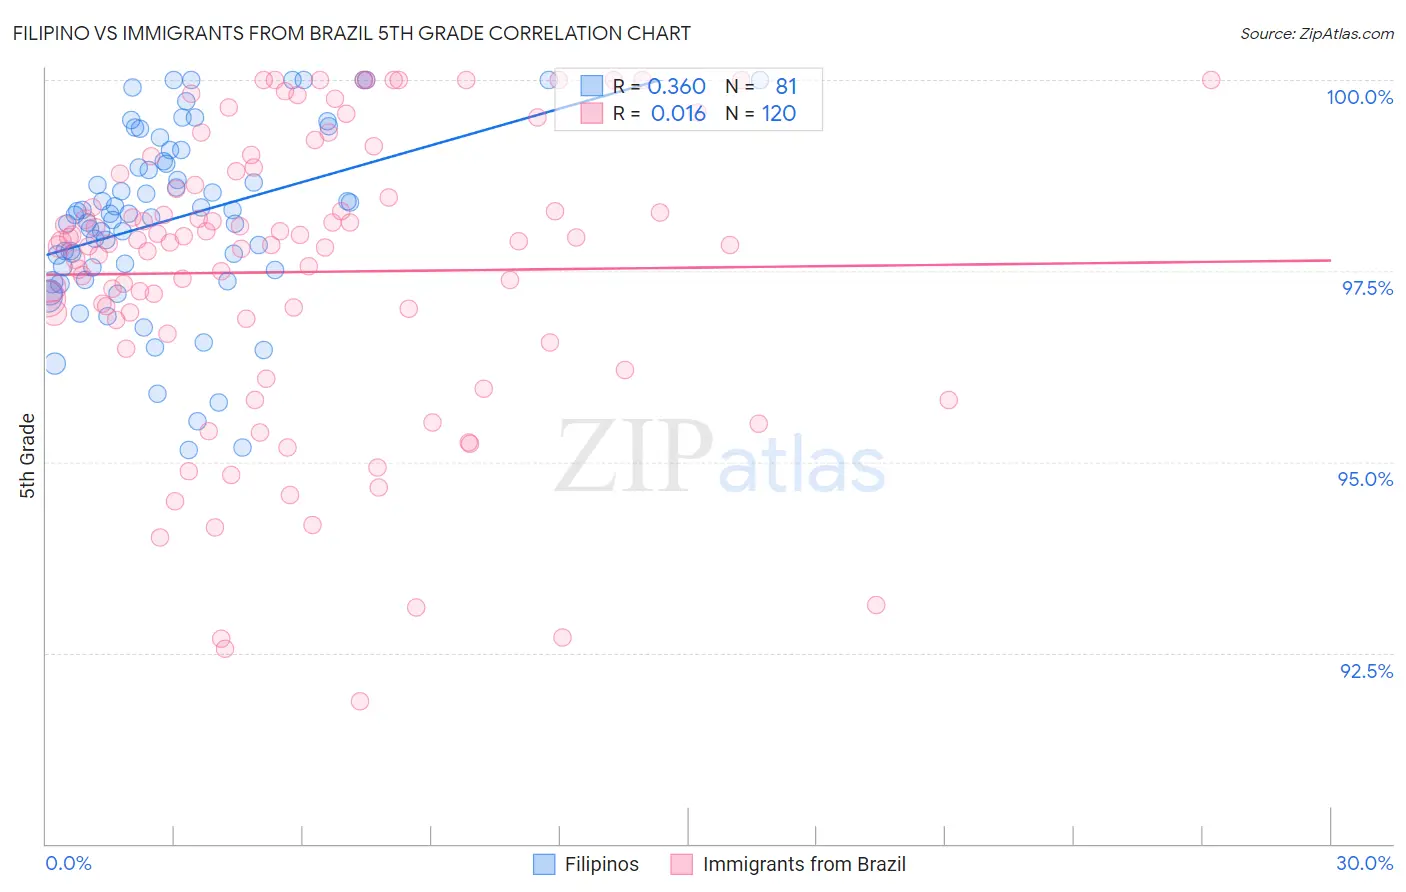
Filipino vs Immigrants from Brazil 5th Grade Correlation Chart
The statistical analysis conducted on geographies consisting of 254,351,427 people shows a mild positive correlation between the proportion of Filipinos and percentage of population with at least 5th grade education in the United States with a correlation coefficient (R) of 0.360 and weighted average of 97.5%. Similarly, the statistical analysis conducted on geographies consisting of 343,021,580 people shows no correlation between the proportion of Immigrants from Brazil and percentage of population with at least 5th grade education in the United States with a correlation coefficient (R) of 0.016 and weighted average of 97.3%, a difference of 0.28%.
5th Grade Correlation Summary
| Measurement | Filipino | Immigrants from Brazil |
| Minimum | 95.2% | 91.9% |
| Maximum | 100.0% | 100.0% |
| Range | 4.8% | 8.1% |
| Mean | 98.2% | 97.5% |
| Median | 98.3% | 97.9% |
| Interquartile 25% (IQ1) | 97.5% | 96.8% |
| Interquartile 75% (IQ3) | 99.0% | 98.7% |
| Interquartile Range (IQR) | 1.5% | 1.9% |
| Standard Deviation (Sample) | 1.2% | 1.9% |
| Standard Deviation (Population) | 1.2% | 1.9% |
Similar Demographics by 5th Grade
Demographics Similar to Filipinos by 5th Grade
In terms of 5th grade, the demographic groups most similar to Filipinos are Blackfeet (97.5%, a difference of 0.0%), Immigrants from Turkey (97.5%, a difference of 0.0%), Immigrants from Moldova (97.5%, a difference of 0.010%), Burmese (97.5%, a difference of 0.010%), and Seminole (97.5%, a difference of 0.010%).
| Demographics | Rating | Rank | 5th Grade |
| Immigrants | Romania | 91.6 /100 | #130 | Exceptional 97.6% |
| Pima | 91.2 /100 | #131 | Exceptional 97.6% |
| Immigrants | Kuwait | 90.4 /100 | #132 | Exceptional 97.6% |
| Cambodians | 90.2 /100 | #133 | Exceptional 97.6% |
| Immigrants | Hungary | 90.1 /100 | #134 | Exceptional 97.6% |
| Palestinians | 89.3 /100 | #135 | Excellent 97.5% |
| Immigrants | Moldova | 87.5 /100 | #136 | Excellent 97.5% |
| Filipinos | 86.8 /100 | #137 | Excellent 97.5% |
| Blackfeet | 86.8 /100 | #138 | Excellent 97.5% |
| Immigrants | Turkey | 86.7 /100 | #139 | Excellent 97.5% |
| Burmese | 86.1 /100 | #140 | Excellent 97.5% |
| Seminole | 85.8 /100 | #141 | Excellent 97.5% |
| Israelis | 85.5 /100 | #142 | Excellent 97.5% |
| Immigrants | North Macedonia | 85.4 /100 | #143 | Excellent 97.5% |
| Immigrants | Greece | 83.2 /100 | #144 | Excellent 97.5% |
Demographics Similar to Immigrants from Brazil by 5th Grade
In terms of 5th grade, the demographic groups most similar to Immigrants from Brazil are Black/African American (97.3%, a difference of 0.0%), Panamanian (97.3%, a difference of 0.0%), Spanish American (97.3%, a difference of 0.010%), Paraguayan (97.3%, a difference of 0.010%), and Immigrants from Egypt (97.3%, a difference of 0.010%).
| Demographics | Rating | Rank | 5th Grade |
| Immigrants | Venezuela | 38.4 /100 | #184 | Fair 97.3% |
| Dutch West Indians | 36.2 /100 | #185 | Fair 97.3% |
| Immigrants | Argentina | 36.1 /100 | #186 | Fair 97.3% |
| Spanish Americans | 34.7 /100 | #187 | Fair 97.3% |
| Paraguayans | 33.7 /100 | #188 | Fair 97.3% |
| Immigrants | Egypt | 32.9 /100 | #189 | Fair 97.3% |
| Blacks/African Americans | 31.8 /100 | #190 | Fair 97.3% |
| Immigrants | Brazil | 31.5 /100 | #191 | Fair 97.3% |
| Panamanians | 31.3 /100 | #192 | Fair 97.3% |
| Navajo | 29.0 /100 | #193 | Fair 97.2% |
| Immigrants | Albania | 28.5 /100 | #194 | Fair 97.2% |
| Guamanians/Chamorros | 26.8 /100 | #195 | Fair 97.2% |
| Hawaiians | 25.6 /100 | #196 | Fair 97.2% |
| Brazilians | 25.4 /100 | #197 | Fair 97.2% |
| Immigrants | Uganda | 21.1 /100 | #198 | Fair 97.2% |